The rates <strong>of</strong> fertilizer calculated for distribution were, therefore, much lowerthan the recommended rates. The supply level <strong>of</strong> fertilizer determ<strong>in</strong>ed dosage.Fertilizer was imported annually. Upon arrival at the Rangoon port <strong>in</strong> theopen season (November to March), it was transported to transit storage placesfor distribution. Locally produced urea also had to be stored <strong>in</strong> various parts<strong>of</strong> the country before distribution. Fertilizer factories ma<strong>in</strong>ta<strong>in</strong>ed daily production,and the AC took care <strong>of</strong> delivery and storage.S<strong>in</strong>ce more than 80% <strong>of</strong> the fertilizer was used for <strong>rice</strong>, the bulk <strong>of</strong> fertilizerdistribution took place between January and May, when farmers disposed <strong>of</strong>their <strong>rice</strong> harvest and bought fertilizer for the next season. This, <strong>in</strong> fact, was thetime the farmers had ready money for fertilizer procurement.Government loans were also disbursed dur<strong>in</strong>g this time. Annual factoryproduction <strong>of</strong> fertilizer did not reveal the supply level for that year, but actualsupply consisted <strong>of</strong> urea <strong>in</strong> storage plus the production output from factories<strong>in</strong> the open season. This amount <strong>of</strong> urea, supplemented by imports, was theamount available for distribution dur<strong>in</strong>g the year. For triple superphosphateand muriate <strong>of</strong> potash, annual procurement plus the balance made up thesupply. Distribution <strong>of</strong> fertilizer dur<strong>in</strong>g this limited period <strong>of</strong>ten createdtransportation problems, especially after the energy crisis. Movement <strong>of</strong> allagricultural products took place dur<strong>in</strong>g the open season, and fertilizer distributionwas only a small portion <strong>of</strong> this huge volume.Table 39 shows the chemical fertilizer supply level for different years and<strong>in</strong> what year utilization was highest. This table was constructed from datapresented <strong>in</strong> Reports to the Pyithu Hluttaw <strong>in</strong> 1984 and 1987. The fertilizersupply level was 200,000 t <strong>in</strong> 1979-80 and rose to 407,000 t <strong>in</strong> 1985-86, an<strong>in</strong>crease <strong>of</strong> more than 100% <strong>in</strong> a short time. The <strong>in</strong>crease was ma<strong>in</strong>ly due to the<strong>in</strong>creased supply <strong>of</strong> urea. This amount, however, did not co<strong>in</strong>cide with theutilization figures <strong>in</strong> Table 37. Utilization <strong>of</strong> fertilizer <strong>in</strong> a particular yeardepends on 1) expansion <strong>of</strong> MV area, 2) availability <strong>of</strong> stock at the distributionTable 39. Fertilizer supply, imports, and domestic production (000 t), 1979-85(SRUB 1984,1987).ImportsLocallyPeriod Triple Muriate produced TotalUrea superphosphate <strong>of</strong> potash urea1979-801980-811981-821982-831983-841984-851985-869.080.7101.0172.093.886.947.954.062.8106.687.561.5130.198.54.09.024.823.517.021.830.0133.9122.2132.5100.5116.5150.4230.8200.9274.7364.9383.5288.8389.2407.2RICE PRODUCTION UNDER THE SOCIALIST REPUBLIC GOVERNMENT 71
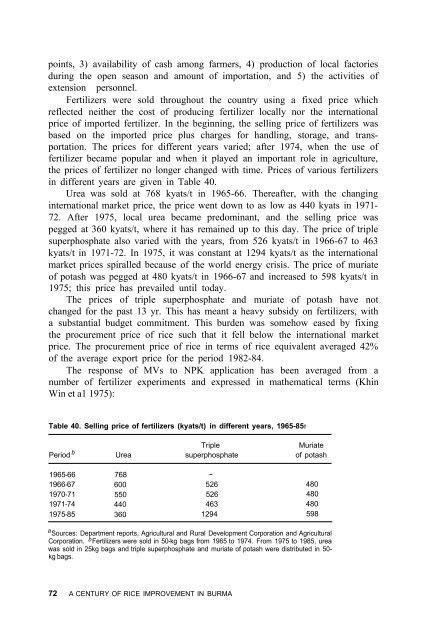
po<strong>in</strong>ts, 3) availability <strong>of</strong> cash among farmers, 4) production <strong>of</strong> local factoriesdur<strong>in</strong>g the open season and amount <strong>of</strong> importation, and 5) the activities <strong>of</strong>extension personnel.Fertilizers were sold throughout the country us<strong>in</strong>g a fixed p<strong>rice</strong> whichreflected neither the cost <strong>of</strong> produc<strong>in</strong>g fertilizer locally nor the <strong>in</strong>ternationalp<strong>rice</strong> <strong>of</strong> imported fertilizer. In the beg<strong>in</strong>n<strong>in</strong>g, the sell<strong>in</strong>g p<strong>rice</strong> <strong>of</strong> fertilizers wasbased on the imported p<strong>rice</strong> plus charges for handl<strong>in</strong>g, storage, and transportation.The p<strong>rice</strong>s for different years varied; after 1974, when the use <strong>of</strong>fertilizer became popular and when it played an important role <strong>in</strong> agriculture,the p<strong>rice</strong>s <strong>of</strong> fertilizer no longer changed with time. P<strong>rice</strong>s <strong>of</strong> various fertilizers<strong>in</strong> different years are given <strong>in</strong> Table 40.Urea was sold at 768 kyats/t <strong>in</strong> 1965-66. Thereafter, with the chang<strong>in</strong>g<strong>in</strong>ternational market p<strong>rice</strong>, the p<strong>rice</strong> went down to as low as 440 kyats <strong>in</strong> 1971-72. After 1975, local urea became predom<strong>in</strong>ant, and the sell<strong>in</strong>g p<strong>rice</strong> waspegged at 360 kyats/t, where it has rema<strong>in</strong>ed up to this day. The p<strong>rice</strong> <strong>of</strong> triplesuperphosphate also varied with the years, from 526 kyats/t <strong>in</strong> 1966-67 to 463kyats/t <strong>in</strong> 1971-72. In 1975, it was constant at 1294 kyats/t as the <strong>in</strong>ternationalmarket p<strong>rice</strong>s spiralled because <strong>of</strong> the world energy crisis. The p<strong>rice</strong> <strong>of</strong> muriate<strong>of</strong> potash was pegged at 480 kyats/t <strong>in</strong> 1966-67 and <strong>in</strong>creased to 598 kyats/t <strong>in</strong>1975; this p<strong>rice</strong> has prevailed until today.The p<strong>rice</strong>s <strong>of</strong> triple superphosphate and muriate <strong>of</strong> potash have notchanged for the past 13 yr. This has meant a heavy subsidy on fertilizers, witha substantial budget commitment. This burden was somehow eased by fix<strong>in</strong>gthe procurement p<strong>rice</strong> <strong>of</strong> <strong>rice</strong> such that it fell below the <strong>in</strong>ternational marketp<strong>rice</strong>. The procurement p<strong>rice</strong> <strong>of</strong> <strong>rice</strong> <strong>in</strong> terms <strong>of</strong> <strong>rice</strong> equivalent averaged 42%<strong>of</strong> the average export p<strong>rice</strong> for the period 1982-84.The response <strong>of</strong> MVs to NPK application has been averaged from anumber <strong>of</strong> fertilizer experiments and expressed <strong>in</strong> mathematical terms (Kh<strong>in</strong>W<strong>in</strong> et a1 1975):Table 40. Sell<strong>in</strong>g p<strong>rice</strong> <strong>of</strong> fertilizers (kyats/t) <strong>in</strong> different years, 1965-85.aTripleMuriatePeriod b Urea superphosphate <strong>of</strong> potash1965-661966-671970-711971-741975-85768600550440360-5265264631294480480480598a Sources: Department reports, Agricultural and Rural Development Corporation and AgriculturalCorporation. b Fertilizers were sold <strong>in</strong> 50-kg bags from 1965 to 1974. From 1975 to 1985, ureawas sold <strong>in</strong> 25kg bags and triple superphosphate and muriate <strong>of</strong> potash were distributed <strong>in</strong> 50-kg bags.72 A CENTURY OF RICE IMPROVEMENT IN BURMA
- Page 3 and 4:
The International Rice Research Ins
- Page 5 and 6:
Rice trading 29Rice milling 29Rice
- Page 8:
ForewordRice dominates Burma’s ec
- Page 11 and 12:
ice production in the last decade.
- Page 14 and 15:
CHAPTER IIntroductionBurma is situa
- Page 16 and 17:
1. Trends in rice area and producti
- Page 18 and 19:
3. Soil distribution.INTRODUCTION 5
- Page 20 and 21:
and the rest of the country in 1885
- Page 22 and 23:
Rice production growth during this
- Page 24 and 25:
4. Rice threshing with cattle.5. Ri
- Page 26 and 27:
7. Transplanting.Farmers classify r
- Page 28:
8. States and Divisions (1-7 are di
- Page 43: Table 11. Rice mills, 1894-1934 (DA
- Page 51 and 52: Rice area and productionAlthough th
- Page 53 and 54: Table 16. Rice production in select
- Page 55 and 56: Tenants of State Agricultural BankA
- Page 57 and 58: in 1960, representing a 17% increas
- Page 59: Table 20. Summary of extension acti
- Page 62 and 63: Table 24. Rice procurement by diffe
- Page 64 and 65: This trade reduction severely affec
- Page 66: conditions and a weak international
- Page 69 and 70: the design, implementation, and eva
- Page 71 and 72: Table 27 indicates the areas plante
- Page 73 and 74: The coastal zone comprised four ric
- Page 78 and 79: In the meantime, local researchers
- Page 80 and 81: Table 35. Rice area planted, by gra
- Page 83: All fertilizers were imported until
- Page 87 and 88: hispa Hispa armigera. Though annual
- Page 89 and 90: The amounts of agricultural loans g
- Page 91 and 92: from double-cropped areas (Table 44
- Page 93 and 94: when investment in the agricultural
- Page 96 and 97: The program brought research and ex
- Page 98 and 99: Table 46. Average area of responsib
- Page 100 and 101: established practice among farmers,
- Page 102 and 103: 12. Voluntary labor harvesting rice
- Page 104 and 105: of harvesting. It sought voluntary
- Page 106 and 107: nents that a larger project would r
- Page 108 and 109: Table 48. Changes in area planted t
- Page 110 and 111: Table 50. Average yield and product
- Page 112 and 113: Results of analysisOf the variables
- Page 114 and 115: Of the 19 variables used, 11 were s
- Page 116 and 117: weather that it influenced rice pro
- Page 118 and 119: Table 54. Present level of technolo
- Page 120 and 121: size of holdings, 40% of the prize
- Page 122 and 123: average yield at that time was 2.20
- Page 124 and 125: Table 59. Monthly transactions of t
- Page 126 and 127: Table 61. Irrigated areas for rice,
- Page 128 and 129: Table 62. Tillage operation by trac
- Page 130 and 131: 18. AFPTC rice procurement center.A
- Page 132 and 133: Table 65. Annual rice procurement (
- Page 134 and 135:
for seeds; still others sold their
- Page 136 and 137:
primarily to help achieve the AFPTC
- Page 138 and 139:
Table 67. Annual rice production an
- Page 140 and 141:
Table 68. Comparison of paid-out co
- Page 142 and 143:
CHAPTER VImplications for the futur
- Page 144 and 145:
agricultural research can be brough
- Page 146 and 147:
Motivation of scientistsUnder these
- Page 148 and 149:
or as individuals. Research is to b
- Page 150 and 151:
CHAPTER VIConclusionsBurma’s econ
- Page 152 and 153:
References citedAdas M (1974) The B
- Page 154:
SRUB—The socialist Republic of th
- Page 157 and 158:
Appendix 1 continuedSown area Produ
- Page 159 and 160:
Appendix II continuedShareRice a Al
- Page 161 and 162:
Appendix IV continuedYear Exports Y
- Page 163 and 164:
Appendix VIcontinuedVariable Symbol
- Page 165 and 166:
All combined1977-84 1977-78 1978-79
- Page 167 and 168:
Appendix VIII. Correlation coeffici
- Page 170 and 171:
IndexAdas, M 6Africa 125, 137Agricu
- Page 172 and 173:
farmers 6-9, 13, 18, 23, 25-26, 29,
- Page 174 and 175:
Okpo Small Loan Department110, 111O