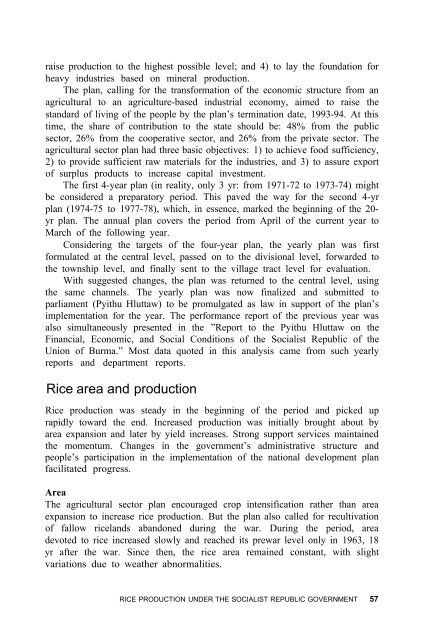
aise production to the highest possible level; and 4) to lay the foundation forheavy <strong>in</strong>dustries based on m<strong>in</strong>eral production.The plan, call<strong>in</strong>g for the transformation <strong>of</strong> the economic structure from anagricultural to an agriculture-based <strong>in</strong>dustrial economy, aimed to raise thestandard <strong>of</strong> liv<strong>in</strong>g <strong>of</strong> the people by the plan’s term<strong>in</strong>ation date, 1993-94. At thistime, the share <strong>of</strong> contribution to the state should be: 48% from the publicsector, 26% from the cooperative sector, and 26% from the private sector. Theagricultural sector plan had three basic objectives: 1) to achieve food sufficiency,2) to provide sufficient raw materials for the <strong>in</strong>dustries, and 3) to assure export<strong>of</strong> surplus products to <strong>in</strong>crease capital <strong>in</strong>vestment.The first 4-year plan (<strong>in</strong> reality, only 3 yr: from 1971-72 to 1973-74) mightbe considered a preparatory period. This paved the way for the second 4-yrplan (1974-75 to 1977-78), which, <strong>in</strong> essence, marked the beg<strong>in</strong>n<strong>in</strong>g <strong>of</strong> the 20-yr plan. The annual plan covers the period from April <strong>of</strong> the current year toMarch <strong>of</strong> the follow<strong>in</strong>g year.Consider<strong>in</strong>g the targets <strong>of</strong> the four-year plan, the yearly plan was firstformulated at the central level, passed on to the divisional level, forwarded tothe township level, and f<strong>in</strong>ally sent to the village tract level for evaluation.With suggested changes, the plan was returned to the central level, us<strong>in</strong>gthe same channels. The yearly plan was now f<strong>in</strong>alized and submitted toparliament (Pyithu Hluttaw) to be promulgated as law <strong>in</strong> support <strong>of</strong> the plan’simplementation for the year. The performance report <strong>of</strong> the previous year wasalso simultaneously presented <strong>in</strong> the ”Report to the Pyithu Hluttaw on theF<strong>in</strong>ancial, Economic, and Social Conditions <strong>of</strong> the Socialist Republic <strong>of</strong> theUnion <strong>of</strong> <strong>Burma</strong>.” Most data quoted <strong>in</strong> this analysis came from such yearlyreports and department reports.Rice area and productionRice production was steady <strong>in</strong> the beg<strong>in</strong>n<strong>in</strong>g <strong>of</strong> the period and picked uprapidly toward the end. Increased production was <strong>in</strong>itially brought about byarea expansion and later by yield <strong>in</strong>creases. Strong support services ma<strong>in</strong>ta<strong>in</strong>edthe momentum. Changes <strong>in</strong> the government’s adm<strong>in</strong>istrative structure andpeople’s participation <strong>in</strong> the implementation <strong>of</strong> the national development planfacilitated progress.AreaThe agricultural sector plan encouraged crop <strong>in</strong>tensification rather than areaexpansion to <strong>in</strong>crease <strong>rice</strong> production. But the plan also called for recultivation<strong>of</strong> fallow <strong>rice</strong>lands abandoned dur<strong>in</strong>g the war. Dur<strong>in</strong>g the period, areadevoted to <strong>rice</strong> <strong>in</strong>creased slowly and reached its prewar level only <strong>in</strong> 1963, 18yr after the war. S<strong>in</strong>ce then, the <strong>rice</strong> area rema<strong>in</strong>ed constant, with slightvariations due to weather abnormalities.RICE PRODUCTION UNDER THE SOCIALIST REPUBLIC GOVERNMENT 57
Table 27 <strong>in</strong>dicates the areas planted to <strong>rice</strong> <strong>in</strong> selected years. The <strong>rice</strong> areaat the end <strong>of</strong> the previous period (4 million ha) rose to 5 million ha, after whichit stabilized. As far as area expansion was concerned, the 4-yr plan targets weremet <strong>in</strong> the beg<strong>in</strong>n<strong>in</strong>g but not quite <strong>in</strong> later years. On the whole, targetachievement was always excellent and reached 96% (even 100%) <strong>in</strong> someyears.Table 28 shows the <strong>rice</strong> area <strong>in</strong> the states and divisions <strong>in</strong> 1978, when thearea sown was at its highest level. The Irrawaddy, Pegu, and RangoonDivisions and the Mon and Arakan States were <strong>rice</strong> surplus areas while therema<strong>in</strong><strong>in</strong>g four divisions and five states were deficit areas. (A <strong>rice</strong> surplussituation exists when the percentage <strong>of</strong> sown area to total area exceeds thepercentage <strong>of</strong> population <strong>in</strong> the area.) The degree <strong>of</strong> surplus and deficit,though, varied. The Irrawaddy, Pegu, and Rangoon Divisions belong to thedelta areas, which provide surplus <strong>rice</strong> for both <strong>in</strong>ternal and external markets.Rice from surplus areas had to be distributed to deficit areas, with therema<strong>in</strong><strong>in</strong>g surplus compris<strong>in</strong>g the export potential. Except for Mandalay andMagwe Divisions, the other five states and two divisions could become selfsufficient<strong>in</strong> <strong>rice</strong> if they could raise their annual <strong>rice</strong> production to a levelslightly higher than that <strong>of</strong> the population. This could be made possible byrais<strong>in</strong>g yields through new technologies. Mandalay and Magwe Divisionswould require more than yield <strong>in</strong>creases to make them self-sufficient; theywould also need more irrigation facilities.In terms <strong>of</strong> <strong>rice</strong> environment, the 14 states and divisions could be grouped<strong>in</strong>to 4: ra<strong>in</strong>fed environment (Irrawaddy, Pegu, and Rangoon), partially irrigatedTable 27. Rice area In <strong>Burma</strong>, 1980-85. aYearTarget area Sown area %(million ha) (million ha) achievementRemark b1960196219641970197419751976197719785.23---5.0185.0985.1665.2005.2174.2174.8375.1094.9755.1775.2045.0775.1365.24381---1031029899101No planSFYPSFYPSFYPSFYPTFYP19791980198119821983198419855.2385.2805.1435.0755.0095.0044.9175.0265.1274.9214.8824.8314.9174.902969796969698100TFYPTFYPTFYPFFYPFFYPFFYPFFYPa 1960-75 data taken from RGUB 1966, 1973, 1978; 1976-85 data taken from SRUB 1984,1987. b SFYP = second four-year plan, TFYP = third four-year plan, FFYP = fourth four-year plan.58 A CENTURY OF RICE IMPROVEMENT IN BURMA
- Page 3 and 4:
The International Rice Research Ins
- Page 5 and 6:
Rice trading 29Rice milling 29Rice
- Page 8:
ForewordRice dominates Burma’s ec
- Page 11 and 12:
ice production in the last decade.
- Page 14 and 15:
CHAPTER IIntroductionBurma is situa
- Page 16 and 17:
1. Trends in rice area and producti
- Page 18 and 19:
3. Soil distribution.INTRODUCTION 5
- Page 20 and 21: and the rest of the country in 1885
- Page 22 and 23: Rice production growth during this
- Page 24 and 25: 4. Rice threshing with cattle.5. Ri
- Page 26 and 27: 7. Transplanting.Farmers classify r
- Page 28: 8. States and Divisions (1-7 are di
- Page 43: Table 11. Rice mills, 1894-1934 (DA
- Page 51 and 52: Rice area and productionAlthough th
- Page 53 and 54: Table 16. Rice production in select
- Page 55 and 56: Tenants of State Agricultural BankA
- Page 57 and 58: in 1960, representing a 17% increas
- Page 59: Table 20. Summary of extension acti
- Page 62 and 63: Table 24. Rice procurement by diffe
- Page 64 and 65: This trade reduction severely affec
- Page 66: conditions and a weak international
- Page 69: the design, implementation, and eva
- Page 73 and 74: The coastal zone comprised four ric
- Page 78 and 79: In the meantime, local researchers
- Page 80 and 81: Table 35. Rice area planted, by gra
- Page 83 and 84: All fertilizers were imported until
- Page 85 and 86: points, 3) availability of cash amo
- Page 87 and 88: hispa Hispa armigera. Though annual
- Page 89 and 90: The amounts of agricultural loans g
- Page 91 and 92: from double-cropped areas (Table 44
- Page 93 and 94: when investment in the agricultural
- Page 96 and 97: The program brought research and ex
- Page 98 and 99: Table 46. Average area of responsib
- Page 100 and 101: established practice among farmers,
- Page 102 and 103: 12. Voluntary labor harvesting rice
- Page 104 and 105: of harvesting. It sought voluntary
- Page 106 and 107: nents that a larger project would r
- Page 108 and 109: Table 48. Changes in area planted t
- Page 110 and 111: Table 50. Average yield and product
- Page 112 and 113: Results of analysisOf the variables
- Page 114 and 115: Of the 19 variables used, 11 were s
- Page 116 and 117: weather that it influenced rice pro
- Page 118 and 119: Table 54. Present level of technolo
- Page 120 and 121:
size of holdings, 40% of the prize
- Page 122 and 123:
average yield at that time was 2.20
- Page 124 and 125:
Table 59. Monthly transactions of t
- Page 126 and 127:
Table 61. Irrigated areas for rice,
- Page 128 and 129:
Table 62. Tillage operation by trac
- Page 130 and 131:
18. AFPTC rice procurement center.A
- Page 132 and 133:
Table 65. Annual rice procurement (
- Page 134 and 135:
for seeds; still others sold their
- Page 136 and 137:
primarily to help achieve the AFPTC
- Page 138 and 139:
Table 67. Annual rice production an
- Page 140 and 141:
Table 68. Comparison of paid-out co
- Page 142 and 143:
CHAPTER VImplications for the futur
- Page 144 and 145:
agricultural research can be brough
- Page 146 and 147:
Motivation of scientistsUnder these
- Page 148 and 149:
or as individuals. Research is to b
- Page 150 and 151:
CHAPTER VIConclusionsBurma’s econ
- Page 152 and 153:
References citedAdas M (1974) The B
- Page 154:
SRUB—The socialist Republic of th
- Page 157 and 158:
Appendix 1 continuedSown area Produ
- Page 159 and 160:
Appendix II continuedShareRice a Al
- Page 161 and 162:
Appendix IV continuedYear Exports Y
- Page 163 and 164:
Appendix VIcontinuedVariable Symbol
- Page 165 and 166:
All combined1977-84 1977-78 1978-79
- Page 167 and 168:
Appendix VIII. Correlation coeffici
- Page 170 and 171:
IndexAdas, M 6Africa 125, 137Agricu
- Page 172 and 173:
farmers 6-9, 13, 18, 23, 25-26, 29,
- Page 174 and 175:
Okpo Small Loan Department110, 111O