

Recreation Study
Recreation Study
Recreation Study
- No tags were found...

You also want an ePaper? Increase the reach of your titles
YUMPU automatically turns print PDFs into web optimized ePapers that Google loves.
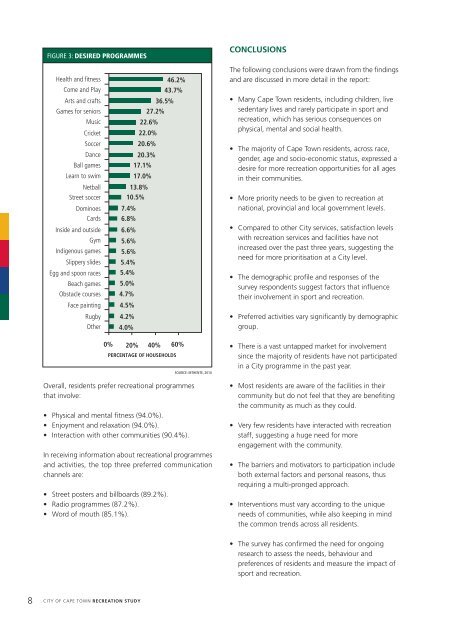
FIGURE 3: DESIRED PROGRAMMESCONCLUSIONSHealth and fitnessCome and PlayArts and craftsGames for seniorsMusicCricketSoccerDanceBall gamesLearn to swimNetballStreet soccerDominoesCardsInside and outsideGymIndigenous gamesSlippery slidesEgg and spoon racesBeach gamesObstacle coursesFace paintingRugbyOther7.4%6.8%6.6%5.6%5.6%5.4%5.4%5.0%4.7%4.5%4.2%4.0%22.6%22.0%20.6%20.3%17.1%17.0%13.8%10.5%27.2%43.7%36.5%46.2%0% 20% 40% 60%PERCENTAGE OF HOUSEHOLDSSOURCE: MTHENTE, 2010The following conclusions were drawn from the findingsand are discussed in more detail in the report:• Many Cape Town residents, including children, livesedentary lives and rarely participate in sport andrecreation, which has serious consequences onphysical, mental and social health.• The majority of Cape Town residents, across race,gender, age and socio-economic status, expressed adesire for more recreation opportunities for all agesin their communities.• More priority needs to be given to recreation atnational, provincial and local government levels.• Compared to other City services, satisfaction levelswith recreation services and facilities have notincreased over the past three years, suggesting theneed for more prioritisation at a City level.• The demographic profile and responses of thesurvey respondents suggest factors that influencetheir involvement in sport and recreation.• Preferred activities vary significantly by demographicgroup.• There is a vast untapped market for involvementsince the majority of residents have not participatedin a City programme in the past year.Overall, residents prefer recreational programmesthat involve:• Physical and mental fitness (94.0%).• Enjoyment and relaxation (94.0%).• Interaction with other communities (90.4%).In receiving information about recreational programmesand activities, the top three preferred communicationchannels are:• Street posters and billboards (89.2%).• Radio programmes (87.2%).• Word of mouth (85.1%).• Most residents are aware of the facilities in theircommunity but do not feel that they are benefitingthe community as much as they could.• Very few residents have interacted with recreationstaff, suggesting a huge need for moreengagement with the community.• The barriers and motivators to participation includeboth external factors and personal reasons, thusrequiring a multi-pronged approach.• Interventions must vary according to the uniqueneeds of communities, while also keeping in mindthe common trends across all residents.• The survey has confirmed the need for ongoingresearch to assess the needs, behaviour andpreferences of residents and measure the impact ofsport and recreation.8 CITY OF CAPE TOWN RECREATION STUDY