

Recreation Study
Recreation Study
Recreation Study
- No tags were found...

Create successful ePaper yourself
Turn your PDF publications into a flip-book with our unique Google optimized e-Paper software.
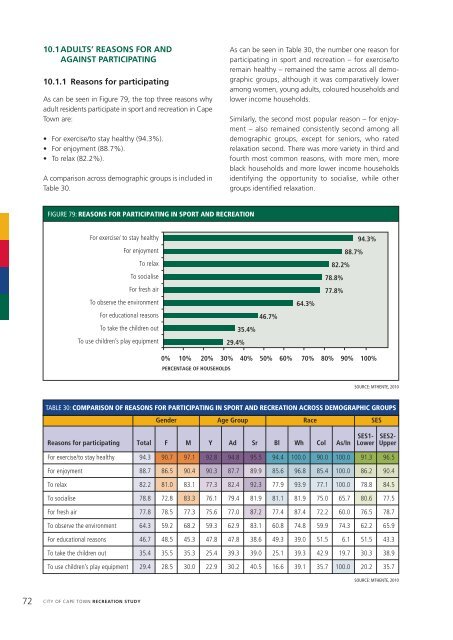
10.1ADULTS’ REASONS FOR ANDAGAINST PARTICIPATING10.1.1 Reasons for participatingAs can be seen in Figure 79, the top three reasons whyadult residents participate in sport and recreation in CapeTown are:• For exercise/to stay healthy (94.3%).• For enjoyment (88.7%).• To relax (82.2%).A comparison across demographic groups is included inTable 30.As can be seen in Table 30, the number one reason forparticipating in sport and recreation – for exercise/toremain healthy – remained the same across all demographicgroups, although it was comparatively loweramong women, young adults, coloured households andlower income households.Similarly, the second most popular reason – for enjoyment– also remained consistently second among alldemographic groups, except for seniors, who ratedrelaxation second. There was more variety in third andfourth most common reasons, with more men, moreblack households and more lower income householdsidentifying the opportunity to socialise, while othergroups identified relaxation.FIGURE 79: REASONS FOR PARTICIPATING IN SPORT AND RECREATIONFor exercise/ to stay healthyFor enjoymentTo relaxTo socialiseFor fresh airTo observe the environmentFor educational reasonsTo take the children outTo use children’s play equipment29.4%35.4%46.7%64.3%94.3%88.7%82.2%78.8%77.8%0% 10% 20% 30% 40% 50% 60% 70% 80% 90% 100%PERCENTAGE OF HOUSEHOLDSSOURCE: MTHENTE, 2010TABLE 30: COMPARISON OF REASONS FOR PARTICIPATING IN SPORT AND RECREATION ACROSS DEMOGRAPHIC GROUPSGender Age Group Race SESReasons for participating Total F M Y Ad Sr Bl Wh Col As/InSES1-LowerSES2-UpperFor exercise/to stay healthy 94.3 90.7 97.1 92.8 94.8 95.5 94.4 100.0 90.0 100.0 91.3 96.5For enjoyment 88.7 86.5 90.4 90.3 87.7 89.9 85.6 96.8 85.4 100.0 86.2 90.4To relax 82.2 81.0 83.1 77.3 82.4 92.3 77.9 93.9 77.1 100.0 78.8 84.5To socialise 78.8 72.8 83.3 76.1 79.4 81.9 81.1 81.9 75.0 65.7 80.6 77.5For fresh air 77.8 78.5 77.3 75.6 77.0 87.2 77.4 87.4 72.2 60.0 76.5 78.7To observe the environment 64.3 59.2 68.2 59.3 62.9 83.1 60.8 74.8 59.9 74.3 62.2 65.9For educational reasons 46.7 48.5 45.3 47.8 47.8 38.6 49.3 39.0 51.5 6.1 51.5 43.3To take the children out 35.4 35.5 35.3 25.4 39.3 39.0 25.1 39.3 42.9 19.7 30.3 38.9To use children’s play equipment 29.4 28.5 30.0 22.9 30.2 40.5 16.6 39.1 35.7 100.0 20.2 35.7SOURCE: MTHENTE, 201072 CITY OF CAPE TOWN RECREATION STUDY