

Recreation Study
Recreation Study
Recreation Study
- No tags were found...

You also want an ePaper? Increase the reach of your titles
YUMPU automatically turns print PDFs into web optimized ePapers that Google loves.
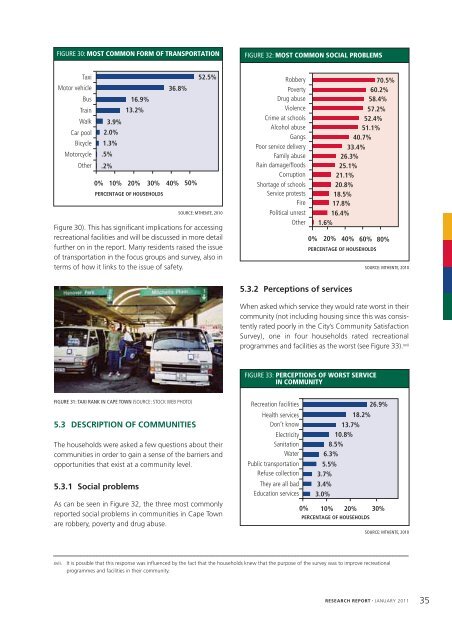
FIGURE 30: MOST COMMON FORM OF TRANSPORTATIONFIGURE 32: MOST COMMON SOCIAL PROBLEMSTaxiMotor vehicleBusTrainWalkCar poolBicycleMotorcycleOther16.9%13.2%3.9%2.0%1.3%.5%.2%36.8%0% 10% 20% 30% 40% 50%PERCENTAGE OF HOUSEHOLDS52.5%SOURCE: MTHENTE, 2010Figure 30). This has significant implications for accessingrecreational facilities and will be discussed in more detailfurther on in the report. Many residents raised the issueof transportation in the focus groups and survey, also interms of how it links to the issue of safety.RobberyPovertyDrug abuseViolenceCrime at schoolsAlcohol abuseGangsPoor service deliveryFamily abuseRain damage/floodsCorruptionShortage of schoolsService protestsFirePolitical unrestOther70.5%60.2%58.4%57.2%52.4%51.1%40.7%33.4%26.3%25.1%21.1%20.8%18.5%17.8%16.4%1.6%0% 20% 40% 60% 80%PERCENTAGE OF HOUSEHOLDSSOURCE: MTHENTE, 20105.3.2 Perceptions of servicesWhen asked which service they would rate worst in theircommunity (not including housing since this was consistentlyrated poorly in the City’s Community SatisfactionSurvey), one in four households rated recreationalprogrammes and facilities as the worst (see Figure 33). xvii 35FIGURE 33: PERCEPTIONS OF WORST SERVICEIN COMMUNITYFIGURE 31: TAXI RANK IN CAPE TOWN (SOURCE: STOCK WEB PHOTO)5.3 DESCRIPTION OF COMMUNITIESThe households were asked a few questions about theircommunities in order to gain a sense of the barriers andopportunities that exist at a community level.5.3.1 Social problemsAs can be seen in Figure 32, the three most commonlyreported social problems in communities in Cape Townare robbery, poverty and drug abuse.<strong>Recreation</strong> facilitiesHealth servicesDon’t knowElectricitySanitationWaterPublic transportationRefuse collectionThey are all badEducation services13.7%10.8%8.5%6.3%5.5%3.7%3.4%3.0%18.2%0% 10% 20% 30%PERCENTAGE OF HOUSEHOLDS26.9%SOURCE: MTHENTE, 2010xvii.It is possible that this response was influenced by the fact that the households knew that the purpose of the survey was to improve recreationalprogrammes and facilities in their community.RESEARCH REPORT JANUARY 2011