

Recreation Study
Recreation Study
Recreation Study
- No tags were found...

You also want an ePaper? Increase the reach of your titles
YUMPU automatically turns print PDFs into web optimized ePapers that Google loves.
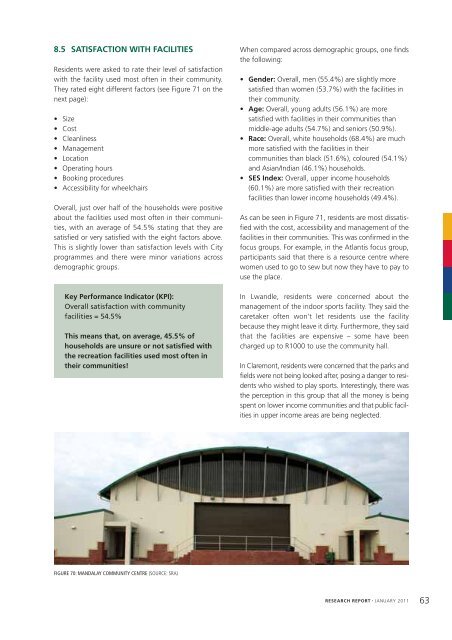
8.5 SATISFACTION WITH FACILITIESResidents were asked to rate their level of satisfactionwith the facility used most often in their community.They rated eight different factors (see Figure 71 on thenext page):• Size• Cost• Cleanliness• Management• Location• Operating hours• Booking procedures• Accessibility for wheelchairsOverall, just over half of the households were positiveabout the facilities used most often in their communities,with an average of 54.5% stating that they aresatisfied or very satisfied with the eight factors above.This is slightly lower than satisfaction levels with Cityprogrammes and there were minor variations acrossdemographic groups.Key Performance Indicator (KPI):Overall satisfaction with communityfacilities = 54.5%This means that, on average, 45.5% ofhouseholds are unsure or not satisfied withthe recreation facilities used most often intheir communities!When compared across demographic groups, one findsthe following:• Gender: Overall, men (55.4%) are slightly moresatisfied than women (53.7%) with the facilities intheir community.• Age: Overall, young adults (56.1%) are moresatisfied with facilities in their communities thanmiddle-age adults (54.7%) and seniors (50.9%).• Race: Overall, white households (68.4%) are muchmore satisfied with the facilities in theircommunities than black (51.6%), coloured (54.1%)and Asian/Indian (46.1%) households.• SES Index: Overall, upper income households(60.1%) are more satisfied with their recreationfacilities than lower income households (49.4%).As can be seen in Figure 71, residents are most dissatisfiedwith the cost, accessibility and management of thefacilities in their communities. This was confirmed in thefocus groups. For example, in the Atlantis focus group,participants said that there is a resource centre wherewomen used to go to sew but now they have to pay touse the place.In Lwandle, residents were concerned about themanagement of the indoor sports facility. They said thecaretaker often won’t let residents use the facilitybecause they might leave it dirty. Furthermore, they saidthat the facilities are expensive – some have beencharged up to R1000 to use the community hall.In Claremont, residents were concerned that the parks andfields were not being looked after, posing a danger to residentswho wished to play sports. Interestingly, there wasthe perception in this group that all the money is beingspent on lower income communities and that public facilitiesin upper income areas are being neglected.FIGURE 70: MANDALAY COMMUNITY CENTRE (SOURCE: SRA)RESEARCH REPORT JANUARY 201163