

Recreation Study
Recreation Study
Recreation Study
- No tags were found...

You also want an ePaper? Increase the reach of your titles
YUMPU automatically turns print PDFs into web optimized ePapers that Google loves.
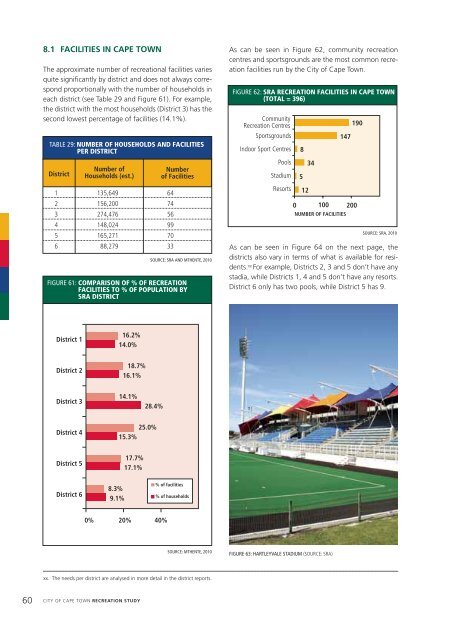
8.1 FACILITIES IN CAPE TOWNThe approximate number of recreational facilities variesquite significantly by district and does not always correspondproportionally with the number of households ineach district (see Table 29 and Figure 61). For example,the district with the most households (District 3) has thesecond lowest percentage of facilities (14.1%).TABLE 29: NUMBER OF HOUSEHOLDS AND FACILITIESPER DISTRICTDistrictNumber ofHouseholds (est.)1 135,649 642 156,200 743 274,476 564 148,024 995 165,271 706 88,279 33Numberof FacilitiesSOURCE: SRA AND MTHENTE, 2010FIGURE 61: COMPARISON OF % OF RECREATIONFACILITIES TO % OF POPULATION BYSRA DISTRICTAs can be seen in Figure 62, community recreationcentres and sportsgrounds are the most common recreationfacilities run by the City of Cape Town.FIGURE 62: SRA RECREATION FACILITIES IN CAPE TOWN(TOTAL = 396)Community<strong>Recreation</strong> CentresSportsgroundsIndoor Sport CentresPoolsStadiumResorts8512340 100147NUMBER OF FACILITIES200190SOURCE: SRA, 2010As can be seen in Figure 64 on the next page, thedistricts also vary in terms of what is available for residents.xx For example, Districts 2, 3 and 5 don’t have anystadia, while Districts 1, 4 and 5 don’t have any resorts.District 6 only has two pools, while District 5 has 9.District 116.2%14.0%District 218.7%16.1%District 314.1%28.4%District 425.0%15.3%District 517.7%17.1%District 68.3%9.1%% of facilities% of households0% 20% 40%SOURCE: MTHENTE, 2010FIGURE 63: HARTLEYVALE STADIUM (SOURCE: SRA)xx. The needs per district are analysed in more detail in the district reports.60 CITY OF CAPE TOWN RECREATION STUDY