Access to beaches and the mountain is difficult andexpensive for many. Similarly, the price of sport andrecreational equipment, gym memberships and facilityrentals is often prohibitive. The influence of gangs andother safety concerns in many communities alsoprevents residents from accessing recreational parks andsports facilities.Without increased support for outdoor recreation andphysical activities, South Africa’s health and socialservices will be overwhelmed by the side-effects. Sportand recreation is an essential service for the physical,mental and social health of a nation.1.1 BACKGROUND TO THE STUDYThe City of Cape Town views sport and recreation as a“vital developmental tool to maximise social developmentthrough the provision of facilities andprogrammes.” 6 Yet faced with the reality describedabove, what is the best approach for the City tocontribute to building active, strong and vibrant communitiesthrough sport and recreation? 7To answer this question, the City needed firsthandfeedback from households in Cape Town to find outtheir current levels of participation and the barriers andenabling factors that contribute to their use of recreationfacilities and programmes run by the City.The Department of Sport, <strong>Recreation</strong> and Amenities(SRA), located within the Department of CommunityServices of the City of Cape Town, thus commissionedMthente Research and Consulting Services (Pty) Ltd toconduct a baseline survey in September 2010 that wouldbe representative of the City’s approximate population of3.5 million residents spread across the SRA’s six districts.1.2 AIM OF THE RESEARCHDue to the fact that the City’s formal sporting codes aregenerally well resourced and provided for, the researchfocused on less-resourced communities and residentswho are not involved in formal sports.The aim of this report is to provide guidance for areamanagers, recreation officers, facility officers and playleaders in their day to day interactions with communities,as well as to inform strategies at the highest level inthe SRA. More specifically, the report aims to:• Provide information about the recreation activitiesand needs of residents, including access to facilitiesand barriers to the use of facilities.• Quantify levels of participation and interest in sportand recreation in communities.• Quantify the barriers and enabling factors that willallow for maximum use and benefit of Councilfacilities (including resorts, sports grounds, indoorsports centres, community halls and stadia)and amenities.• Identify and recommend opportunities forCouncil/SRA to facilitate and assist communityrecreation initiatives at Council facilities.• Make recommendations for the SRA to influenceand attract the inactive population of the city tobecome more active in informal sport andrecreation activities.FIGURE 6: YOUTH ENJOYING RECREATION DURING PRINCE ALBERT'S VISIT TOGUGULETHU, 2010 (SOURCE: SRA)1.3 METHODOLOGYThe research team used a combination of qualitative andquantitative research methodologies. These includeddesktop research, consultations with SRA staff, focusgroups with Cape Town residents, stakeholder interviewswith experts in the field, and a quantitativebaseline survey with 1 500 metro residents. ii. For more information about the methodology used to undertake the study, please contact Mthente Research and Consulting Services at 021 674 0504.14 CITY OF CAPE TOWN RECREATION STUDY
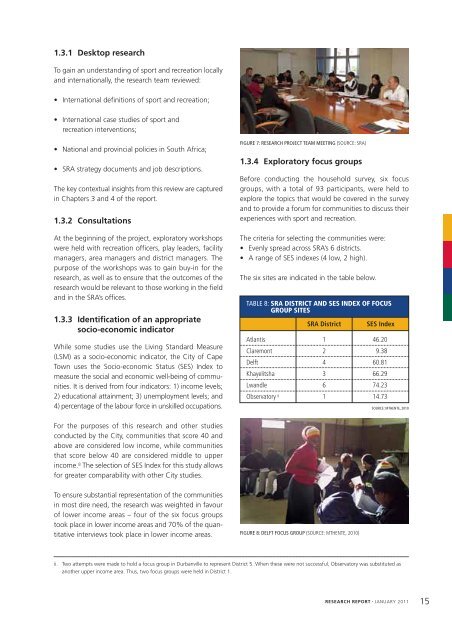
1.3.1 Desktop researchTo gain an understanding of sport and recreation locallyand internationally, the research team reviewed:• International definitions of sport and recreation;• International case studies of sport andrecreation interventions;• National and provincial policies in South Africa;• SRA strategy documents and job descriptions.The key contextual insights from this review are capturedin Chapters 3 and 4 of the report.1.3.2 ConsultationsAt the beginning of the project, exploratory workshopswere held with recreation officers, play leaders, facilitymanagers, area managers and district managers. Thepurpose of the workshops was to gain buy-in for theresearch, as well as to ensure that the outcomes of theresearch would be relevant to those working in the fieldand in the SRA’s offices.1.3.3 Identification of an appropriatesocio-economic indicatorWhile some studies use the Living Standard Measure(LSM) as a socio-economic indicator, the City of CapeTown uses the Socio-economic Status (SES) Index tomeasure the social and economic well-being of communities.It is derived from four indicators: 1) income levels;2) educational attainment; 3) unemployment levels; and4) percentage of the labour force in unskilled occupations.FIGURE 7: RESEARCH PROJECT TEAM MEETING (SOURCE: SRA)1.3.4 Exploratory focus groupsBefore conducting the household survey, six focusgroups, with a total of 93 participants, were held toexplore the topics that would be covered in the surveyand to provide a forum for communities to discuss theirexperiences with sport and recreation.The criteria for selecting the communities were:• Evenly spread across SRA’s 6 districts.• A range of SES indexes (4 low, 2 high).The six sites are indicated in the table below.TABLE 8: SRA DISTRICT AND SES INDEX OF FOCUSGROUP SITESSRA DistrictSES IndexAtlantis 1 46.20Claremont 2 9.38Delft 4 60.81Khayelitsha 3 66.29Lwandle 6 74.23Observatory ii 1 14.73SOURCE: MTHENTE, 2010For the purposes of this research and other studiesconducted by the City, communities that score 40 andabove are considered low income, while communitiesthat score below 40 are considered middle to upperincome. 8 The selection of SES Index for this study allowsfor greater comparability with other City studies.To ensure substantial representation of the communitiesin most dire need, the research was weighted in favourof lower income areas – four of the six focus groupstook place in lower income areas and 70% of the quantitativeinterviews took place in lower income areas.FIGURE 8: DELFT FOCUS GROUP (SOURCE: MTHENTE, 2010)ii.Two attempts were made to hold a focus group in Durbanville to represent District 5. When these were not successful, Observatory was substituted asanother upper income area. Thus, two focus groups were held in District 1.RESEARCH REPORT JANUARY 201115


