

Recreation Study
Recreation Study
Recreation Study
- No tags were found...

Create successful ePaper yourself
Turn your PDF publications into a flip-book with our unique Google optimized e-Paper software.
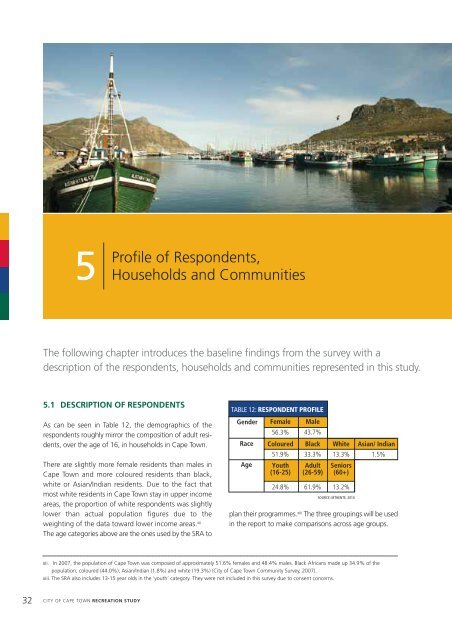
FIGURE 7: YOUNG SPORTS FAN AT RECREATION FESTIVAL IN MITCHELLS PLAIN (SOURCE: SRA)5Profile of Respondents,Households and CommunitiesThe following chapter introduces the baseline findings from the survey with adescription of the respondents, households and communities represented in this study.5.1 DESCRIPTION OF RESPONDENTSAs can be seen in Table 12, the demographics of therespondents roughly mirror the composition of adult residents,over the age of 16, in households in Cape Town.There are slightly more female residents than males inCape Town and more coloured residents than black,white or Asian/Indian residents. Due to the fact thatmost white residents in Cape Town stay in upper incomeareas, the proportion of white respondents was slightlylower than actual population figures due to theweighting of the data toward lower income areas. xiiThe age categories above are the ones used by the SRA toTABLE 12: RESPONDENT PROFILEGenderRaceAgeFemale Male56.3% 43.7%Coloured Black White Asian/ Indian51.9% 33.3% 13.3% 1.5%Youth(16-25)Adult(26-59)Seniors(60+)24.8% 61.9% 13.2%SOURCE: MTHENTE, 2010plan their programmes. xiii The three groupings will be usedin the report to make comparisons across age groups.xii. In 2007, the population of Cape Town was composed of approximately 51.6% females and 48.4% males. Black Africans made up 34.9% of thepopulation; coloured (44.0%); Asian/Indian (1.8%) and white (19.3%) (City of Cape Town Community Survey, 2007).xiii. The SRA also includes 13-15 year olds in the ‘youth’ category. They were not included in this survey due to consent concerns.32 CITY OF CAPE TOWN RECREATION STUDY