- Page 1 and 2: Mitutoyo Precision Measuring Machin
- Page 3 and 4: One number to serve you better:Toll
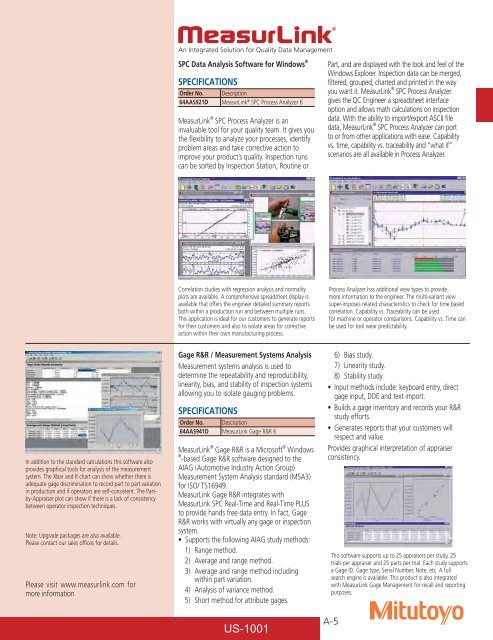
- Page 5 and 6: www.mitutoyo.comThe new US-1001 Cat
- Page 7 and 8: Calibration ServicesMitutoyo Americ
- Page 9 and 10: ■ Sales■ Research andDevelopmen
- Page 11 and 12: Traceability Mitutoyo North America
- Page 13 and 14: CanadaMexicoUKNetherlandGermanySwit
- Page 15 and 16: Certificate of JCSS accredited labo
- Page 17 and 18: ASmall Tool Instruments andData Man
- Page 19: Versatile. Powerful. Easy-to-Use. T
- Page 23 and 24: The Pocket ML combined chartis cust
- Page 25 and 26: U-WAVEMeasurement Data Wireless Com
- Page 27 and 28: Multiplexers - MIG-2B, MIG-4ASERIES
- Page 29 and 30: DP-1VRSERIES 264 — Digimatic Mini
- Page 31 and 32: BSmall Tool Instruments andData Man
- Page 33 and 34: SPECIFICATIONSMetricRange Resolutio
- Page 35 and 36: QuantuMikeSERIES 293 — Coolant Pr
- Page 37 and 38: QuickmikeSERIES 293 — IP-54 ABSOL
- Page 39 and 40: Ratchet Thimble MicrometerSERIES 10
- Page 41 and 42: Outside MicrometersSERIES 103Techni
- Page 43 and 44: Outside MicrometersSERIES 103 — I
- Page 45 and 46: Outside MicrometersSERIES 340, 104
- Page 47 and 48: Technical DataAccuracy: Refer to th
- Page 49 and 50: Spline MicrometersSERIES 331, 111Te
- Page 51 and 52: DIMENSIONS Unit: mmRange L a b c
- Page 53 and 54: SPECIFICATIONSMetricRange Graduatio
- Page 55 and 56: Pana MicrometersSERIES 116 — Inte
- Page 57 and 58: Tube MicrometersSERIES 395, 295, 11
- Page 59 and 60: Sheet Metal MicrometersSERIES 389,
- Page 61 and 62: Disk MicrometersSERIES 323, 223, 12
- Page 63 and 64: Technical DataAccuracy: Refer to th
- Page 65 and 66: Gear Tooth MicrometersSERIES 324, 1
- Page 67 and 68: Screw Thread MicrometersSERIES 326,
- Page 69 and 70: Can Seam MicrometersSERIES 147Techn
- Page 71 and 72:
Digit Outside MicrometersSERIES 193
- Page 73 and 74:
Technical DataDial reading: .00005
- Page 75 and 76:
Groove MicrometersSERIES 146FEATURE
- Page 77 and 78:
Micrometer StandsSERIES 156These st
- Page 79 and 80:
Technical Data Parallelism Check
- Page 81 and 82:
Standards for Screw Thread Micromet
- Page 83 and 84:
Tool KitsThis Tool Kit contains the
- Page 85 and 86:
Micrometer Head Selection GuideVari
- Page 87 and 88:
Digimatic Micrometer HeadsSERIES 35
- Page 89 and 90:
Micrometer HeadsSERIES 148 — Fine
- Page 91 and 92:
ø14Micrometer HeadsSERIES 148 —
- Page 93 and 94:
Micrometer HeadsSERIES 148 — Comm
- Page 95 and 96:
150-801150-191Technical DataGraduat
- Page 97 and 98:
Micrometer HeadsSERIES 153 — Non-
- Page 99 and 100:
Micrometer HeadsSERIES 110 — Diff
- Page 103 and 104:
Micrometer HeadsSERIES 250 — with
- Page 105 and 106:
Fixtures for Micrometer HeadsFEATUR
- Page 107 and 108:
CSmall Tool Instruments andData Man
- Page 109 and 110:
SPECIFICATIONSMetricIndividualRange
- Page 111 and 112:
SPECIFICATIONSMetricIndividualRange
- Page 113 and 114:
ConeHT (Type II)ContactpointCarbide
- Page 115 and 116:
Interchangeable Contact Head Set568
- Page 117 and 118:
Tubular Inside MicrometersSERIES 13
- Page 119 and 120:
Inside MicrometersSERIES 141 — In
- Page 121 and 122:
Tubular Inside MicrometersSERIES 13
- Page 123 and 124:
Tubular Inside MicrometersSERIES 14
- Page 125 and 126:
Inside Micro CheckerSERIES 515FEATU
- Page 127 and 128:
Bore GagesSERIES 511—Standard Typ
- Page 129 and 130:
Bore GagesSERIES 511 — Short Leg
- Page 131 and 132:
Bore GagesSERIES 511 — with Micro
- Page 133 and 134:
ABSOLUTE Digimatic Bore GageSERIES
- Page 135 and 136:
Standard Accessories64AAA012: 21BZA
- Page 137 and 138:
Ceramic Setting RingSERIES 177 —
- Page 139 and 140:
DSmall Tool Instruments andData Man
- Page 141 and 142:
ABSOLUTE Solar CaliperSERIES 500
- Page 143 and 144:
Air leakage detection system used f
- Page 145 and 146:
500-506-10500-502-10500-501-10 500-
- Page 147 and 148:
"Quadri" (4-way) Measurement1. Outs
- Page 149 and 150:
“Quadri” (4 way) MeasurementMea
- Page 151 and 152:
Vernier CaliperSERIES 532 — with
- Page 153 and 154:
ABSOLUTE Digimatic & Vernier Calipe
- Page 155 and 156:
ABSOLUTE Digimatic & Vernier Calipe
- Page 157 and 158:
552-151-10Ceramic jawsCenterline at
- Page 159 and 160:
ABSOLUTE Back-Jaw Centerline Calipe
- Page 161 and 162:
Offset Centerline CaliperSERIES 573
- Page 163 and 164:
Blade Type CaliperSERIES 573, 536
- Page 165 and 166:
Tube Thickness CaliperSERIES 573, 5
- Page 167 and 168:
Scribing CaliperSERIES 573, 536 —
- Page 169 and 170:
DIMENSIONS AND MASSUnit: mmKnife-ed
- Page 171 and 172:
Center Line GageOptional Accessorie
- Page 173 and 174:
Digimatic Height GageSERIES 192 —
- Page 175 and 176:
ABSOLUTE Digimatic Height GageSERIE
- Page 177 and 178:
Technical Data Repeatability: .0001
- Page 179 and 180:
Vernier Height GageSERIES 506 — L
- Page 181 and 182:
CERA Caliper CheckerSERIES 515FEATU
- Page 183 and 184:
Optional Accessories12AAC072: q Dep
- Page 185 and 186:
Optional Accessories12AAC072: Depth
- Page 187 and 188:
Depth MicrometerSERIES 128Technical
- Page 189 and 190:
Vernier Depth GageSERIES 527FEATURE
- Page 191 and 192:
Technical DataDial reading: .001”
- Page 193 and 194:
DIMENSIONSUnit: mm(10) (114)12ø8ø
- Page 195 and 196:
ESmall Tool Instruments andData Man
- Page 197 and 198:
Grade and ApplicationRefer to the f
- Page 199 and 200:
Metric Rectangular Gage Block SetSE
- Page 201 and 202:
Inch Rectangular Gage Block SetSERI
- Page 203 and 204:
Individual Metric RectangularGage B
- Page 205 and 206:
Suffix Number for Selecting Standar
- Page 207 and 208:
Rectangular Gage Block AccessoriesS
- Page 209 and 210:
Rectangular Gage Block AccessoriesH
- Page 211 and 212:
Provided with Inspection Certificat
- Page 213 and 214:
Suffix Number for Selecting Standar
- Page 215 and 216:
Half round jaw:Used to measure an i
- Page 217 and 218:
Step MasterSERIES 516FEATURESStep m
- Page 219 and 220:
Technical DataGraduation: .00001" o
- Page 221 and 222:
Technical DataGraduation: .00001"Co
- Page 223 and 224:
Technical DataMeasuring range (R):
- Page 225 and 226:
Snap Gage CheckerSERIES 515Technica
- Page 227 and 228:
Technical DataAccuracy (at 20°C):
- Page 229 and 230:
Knife Edge Straight EdgeSERIES 528T
- Page 231 and 232:
Combination Square SetSERIES 180Tec
- Page 233 and 234:
Steel RulesSERIES 182FEATURES• Cl
- Page 235 and 236:
Thickness GagesSERIES 950, 184Techn
- Page 237 and 238:
Universal Bevel ProtractorSERIES 18
- Page 239 and 240:
Depth Gage, Adjustable AngleSERIES
- Page 241 and 242:
Angle BlocksSERIES 981SPECIFICATION
- Page 243 and 244:
Radius Gages-SetsSERIES 186FEATURES
- Page 245 and 246:
Center GageSERIES 950FEATURES• Ha
- Page 247 and 248:
985-144985-143Center FinderSERIES 9
- Page 249 and 250:
Bench ComparatorSERIES 162Technical
- Page 251 and 252:
Digital Hand TachometersSERIES 982F
- Page 253 and 254:
Granite Surface Plate AccessoriesSE
- Page 255 and 256:
SIZEHInchSize50 lbs.-Load / sq. ft.
- Page 257 and 258:
FSmall Tool Instruments andData Man
- Page 259 and 260:
ABSOLUTE Digimatic Indicator ID-USE
- Page 261 and 262:
330° Rotary displayThe display can
- Page 263 and 264:
ABSOLUTE Digimatic Indicator ID-CSE
- Page 265 and 266:
ABSOLUTE Digimatic Indicator ID-CSE
- Page 267 and 268:
ABSOLUTE Digimatic Indicator ID-FSE
- Page 269 and 270:
EC CounterSERIES 542 — Low-cost,
- Page 271 and 272:
Dial IndicatorsSERIES 0 - Compact t
- Page 273 and 274:
Dial IndicatorsSERIES 11040S1013S10
- Page 275 and 276:
Dial IndicatorsSERIES 2 — Standar
- Page 277 and 278:
Special Dial IndicatorsSERIES 2Adju
- Page 279 and 280:
ABBDial IndicatorsSERIES 2 — Stan
- Page 281 and 282:
Dial IndicatorsSERIES 2 — Metric
- Page 283 and 284:
Dial IndicatorsSERIES 3 — Large D
- Page 285 and 286:
Dial IndicatorsSERIES 4 — Large D
- Page 287 and 288:
Back Plunger Type Dial IndicatorsSE
- Page 289 and 290:
25ϒContact PointsOptional Accessor
- Page 291 and 292:
Spindle Lifting Lever and CableOpti
- Page 293 and 294:
Dial Indicator Repair Tool KitOptio
- Page 295 and 296:
Dial Test IndicatorsSERIES 513 —
- Page 297 and 298:
Dial Test IndicatorsSERIES 513 —
- Page 299 and 300:
Pocket Type Dial Test IndicatorsSER
- Page 301 and 302:
Set Configuration: MetricFull setCo
- Page 303 and 304:
Technical DataMeasuring Range: 100m
- Page 305 and 306:
Thickness GagesSERIES 547, 7Technic
- Page 307 and 308:
Thickness GagesSERIES 547, 7Tube th
- Page 309 and 310:
Technical DataAccuracy: Refer to th
- Page 311 and 312:
991212Digimatic Caliper GagesSERIES
- Page 313 and 314:
Type of Contact PointsSUpper / Lowe
- Page 315 and 316:
ApplicationMeasuring contact force
- Page 317 and 318:
Dial/Digimatic Indicator & Magnetic
- Page 319 and 320:
519-109ETransfer StandSERIES 519The
- Page 321 and 322:
GSensor SystemsLinear GagesLaser Sc
- Page 323 and 324:
Linear GageDisplay50mm 100mm Single
- Page 325 and 326:
Linear Gage LGKSERIES 542 — 0.1μ
- Page 327 and 328:
10.6Linear Gage LGF-Z with Origin P
- Page 329 and 330:
Linear Gage LGSSERIES 575 — .0005
- Page 331 and 332:
Technical Data Stem: ø15mm Op
- Page 333 and 334:
EC CounterSERIES 542 — Assembly T
- Page 335 and 336:
EG CounterSERIES 542 — Assembly T
- Page 337 and 338:
FunctionOutputExternal ControlRS Li
- Page 339 and 340:
Litematic and Litematic HeadSERIES
- Page 341 and 342:
Laser Scan Micrometer Selection Gui
- Page 343 and 344:
Laser Scan Micrometer LSM-9506SERIE
- Page 345 and 346:
Laser Scan Micrometer LSM-500SSERIE
- Page 347 and 348:
Laser Scan Micrometer LSM-503SSERIE
- Page 349 and 350:
Laser Scan Micrometer LSM-512SSERIE
- Page 351 and 352:
LSM-5200 Display UnitSERIES 544 —
- Page 353 and 354:
Laser Scan MicrometerApplication Ex
- Page 355 and 356:
ABSOLUTE Digimatic Scale UnitsSERIE
- Page 357 and 358:
ABSOLUTE Digimatic Scale UnitsSERIE
- Page 359 and 360:
Quill Kit with ABSOLUTE EncoderEasy
- Page 361 and 362:
Linear ScaleLinear Encoder SystemSy
- Page 363 and 364:
AT116 Linear ScalesSERIES 539 — E
- Page 365 and 366:
AT715 Linear ScalesSERIES 539 — A
- Page 367 and 368:
AT212 Linear ScalesSERIES 539 — S
- Page 369 and 370:
ST700 Series Linear ScalesSERIES 57
- Page 371 and 372:
KA CounterSERIES 174 — Standard T
- Page 373 and 374:
PSU-200SERIES 539 — Pulse Signal
- Page 375 and 376:
PJ-A3000SERIES 302 — Vertical Pro
- Page 377 and 378:
PJ-H30SERIES 303 — High Accuracy
- Page 379 and 380:
PV-5110SERIES 304 — Profile Proje
- Page 381 and 382:
PV-600ASERIES 305 — Profile Proje
- Page 383 and 384:
PH-A14SERIES 172 — Profile Projec
- Page 385 and 386:
PH-3515FSERIES 172 — Profile Proj
- Page 387 and 388:
Accessories for Profile ProjectorsS
- Page 389 and 390:
Micrometer Headsfor Profile Project
- Page 391 and 392:
TM-505/510SERIES 176 — Toolmaker'
- Page 393 and 394:
MFSERIES 176 — Measuring Microsco
- Page 395 and 396:
MF-USERIES 176 — High-power Multi
- Page 397 and 398:
Hyper MF/MF-USERIES 176 — High-Ac
- Page 399 and 400:
Accessories for Measuring Microscop
- Page 401 and 402:
QM-Data200SERIES 264 — 2-D Data P
- Page 403 and 404:
Vision UnitSERIES 359 — Vision Sy
- Page 405 and 406:
FS-70SERIES 378 — Microscope Unit
- Page 407 and 408:
VMUSERIES 378 — Video Microscope
- Page 409 and 410:
M Plan Apo for Bright Field Observa
- Page 411 and 412:
BD Plan Apo HR for Bright/Dark Fiel
- Page 413 and 414:
MSM-400SERIES 377 — Stereo Micros
- Page 415 and 416:
MSM-400SERIES 377 — Stereo Micros
- Page 417 and 418:
Pocket MagnifiersSERIES 183FEATURES
- Page 419 and 420:
Surftest SJ-301 / SJ-210SERIES 178
- Page 421 and 422:
Surftest SJ-301 / SJ-210SERIES 178
- Page 423 and 424:
Surftest SJ-400SERIES 178 — Porta
- Page 425 and 426:
Surftest SJ-500/P, SV-2100SERIES 17
- Page 427 and 428:
Surftest SV-3100SERIES 178 — Surf
- Page 429 and 430:
Surftest Extreme SV-3000CNC / SV-M3
- Page 431 and 432:
Surftest Extreme SV-3000CNC+ Vision
- Page 433 and 434:
Formtracer SV-C3100 / SV-C4100SERIE
- Page 435 and 436:
Formtracer Extreme SV-C3000CNC / SV
- Page 437 and 438:
Formtracer CS-3200SERIES 525 — Fo
- Page 439 and 440:
Formtracer Extreme CS-5000CNC / CS-
- Page 441 and 442:
Formtracer Extreme CS-H5000CNC+ Vis
- Page 443 and 444:
Optional Styli for Surface Roughnes
- Page 445 and 446:
Optional Accessories for Automatic
- Page 447 and 448:
Contracer CV-1000 / CV-2000SERIES 2
- Page 449 and 450:
Contracer CV-3100 / CV-4100SERIES 2
- Page 451 and 452:
Contracer Extreme CV-3000CNC / CV-4
- Page 453 and 454:
Optional Arms and Styli for Contour
- Page 455 and 456:
Optional Accessories for Automatic
- Page 457 and 458:
Roundtest RA-10SERIES 211 — Round
- Page 459 and 460:
Roundtest RA-120 / 120PSERIES 211
- Page 461 and 462:
Roundtest RA-220SERIES 211 — Roun
- Page 463 and 464:
Roundtest RA-1400 / RA-1500SERIES 2
- Page 465 and 466:
Roundtest RA-2200AS / DS / AH / DHS
- Page 467 and 468:
Roundtest RA-H5200AS / AHSERIES 211
- Page 469 and 470:
Roundtest ExtremeRA-2200CNC / RA-H5
- Page 471 and 472:
Optional Styli for Roundtest† Int
- Page 473 and 474:
Optional Accessories for RoundtestC
- Page 475 and 476:
Lineup of Hardness Testing Machines
- Page 477 and 478:
HM-101 / 112 / 113 / 122 / 123SERIE
- Page 479 and 480:
HM-211 / 221SERIES 810 — Micro Ha
- Page 481 and 482:
AAV-500SERIES 810 — Automatic Vic
- Page 483 and 484:
HV-112 / 113 / 114 / 115SERIES 810
- Page 485 and 486:
Rockwell hardness scalesPreliminary
- Page 487 and 488:
AR-20, ARK-600 / 601, ATK-600 / 601
- Page 489 and 490:
Optional AccessoriesFor Rockwell/Ro
- Page 491 and 492:
Hardmatic HH-300SERIES 811 — Duro
- Page 493 and 494:
LCoordinate Measuring MachinesCoord
- Page 495 and 496:
Crysta-Apex CSERIES 191 — Standar
- Page 497 and 498:
STRATO-ApexSERIES 355 — High Accu
- Page 499 and 500:
CARBstrato / CARBapexSERIES 355 —
- Page 501 and 502:
Crysta-Plus M443 / 574 / 7106SERIES
- Page 503 and 504:
CMM ProbesTP7MHigh accuracy typeTP2
- Page 505 and 506:
LCoordinate Measuring MachinesCoord
- Page 507 and 508:
QV Apex / Hyper QVSERIES 363 — CN
- Page 509 and 510:
QV HYBRID TYPE1, TYPE3SERIES 365
- Page 511 and 512:
QV ACCELSERIES 363 — CNC Vision M
- Page 513 and 514:
Quick ScopeSERIES 359 — CNC / Man