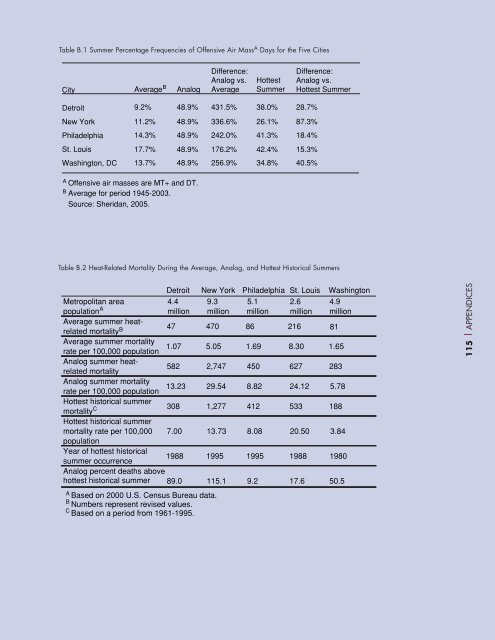
Table B.1 Summer Percentage Frequencies of Offensive Air Mass A Days for the Five CitiesCityAverageBAnalogDifference:Analog vs.AverageHottestSummerDifference:Analog vs.Hottest SummerDetroit 9.2%New York 11.2%Philadelphia 14.3%St. Louis 17.7%Washington, DC 13.7%48.9%48.9%48.9%48.9%48.9%431.5% 38.0% 28.7%336.6% 26.1% 87.3%242.0%176.2%256.9%41.3%42.4%34.8%18.4%15.3%40.5%A Offensive air masses are MT+ <strong>and</strong> DT.B Average for period 1945-2003.Source: Sheridan, 2005.Table B.2 Heat-Related Mortality During the Average, Analog, <strong>and</strong> Hottest Historical SummersDetroit New York Philadelphia St. Louis WashingtonMetropolitan areapopulation A 4.4million9.3million5.1million2.6million4.9millionAverage summer heatrelatedmortality B 47 470 86 216 81Average summer mortalityrate per 100,000 population1.07 5.05 1.69 8.30 1.65Analog summer heatrelatedmortality582 2,747 450 627 283Analog summer mortalityrate per 100,000 population13.23 29.54 8.82 24.12 5.78Hottest historical summermortality C 308 1,277 412 533 188Hottest historical summermortality rate per 100,000 7.00 13.73 8.08 20.50 3.84populationYear of hottest historicalsummer occurrence1988 1995 1995 1988 1980Analog percent deaths abovehottest historical summer 89.0 115.1 9.2 17.6 50.5A Based on 2000 U.S. Census Bureau data.B Numbers represent revised values.C Based on a period from 1961-1995.115 | APPENDICES
The number of consecutive days within offensive air masses is also very unusual for the analog summer. There are twovery long consecutive day strings of MT+ <strong>and</strong> DT air masses: from July 10 through July 22 <strong>and</strong> from August 2through August 17. Using Washington, DC, as an example, in 1995, the hottest summer during the 59-year historicperiod, there were 12 offensive air mass days between July 14 <strong>and</strong> August 4, but no more than 3 of these dayswere consecutive. In Philadelphia, the 1995 heat wave was more severe than in Washington, DC, yet in terms ofconsecutive days, it was still far less extreme than the analog summer. From July 13 to August 4, 1995, there were20 offensive air mass days, but with several breaks when non-offensive air mass days lasted at least two days.Maximum <strong>and</strong> minimum temperatures during the analog summer are far in excess of anything that has occurred inrecorded history. Using Philadelphia as an example again, 15 days recorded maximum temperatures that exceed38 o C (100 o F) during the analog summer. On average, such an extreme event occurs less than once a year.During the hottest-recorded summer over the past 59 years, 1995, this threshold was reached only once. Fifteendays in the analog summer break maximum temperature records, <strong>and</strong> from August 4 to August13, nine of the tendays break records. In addition, four days break the all-time maximum temperature record for Philadelphia, 41 o C(106 o F), with three of these occurring during the 10-day span in August.APPENDIX C. FINANCE: PROPERTY INSURANCE DYNAMICS116 | APPENDICESOverall costs from catastrophic weather-related events rose from an average of US $4 billion per year during the1950s, to US $46 billion per year in the 1990s, <strong>and</strong> almost double that in 2004. In 2004, the combinedweather-related losses from catastrophic <strong>and</strong> small events were US $107 billion, setting a new record. (Total lossesin 2004, including non-weather-related losses, were US $123 billion; Swiss Re 2005a). With HurricanesKatrina <strong>and</strong> Rita, 2005 had, by September, broken all-time records yet again. Meanwhile, the insured percentageof catastrophic losses nearly tripled from 11% in the 1960s to 26% in the 1990s <strong>and</strong> reached 42% (US$44.6 billion) in 2004 (all values inflation-corrected to 2004 dollars, Munich Re NatCatSERVICE).Damage to Physical Structures <strong>and</strong> Other Stationary Property: The current pattern of increasing property lossesdue to catastrophic events — averaging approximately US $20 billion/year in the 1990s — continues to risesteadily (Swiss Re 2005). Assuming that trends observed over the past 50 years continue, average annual insuredlosses reach US $50 billion (in US $2004 dollars) by the year 2025. 2 Peak-year losses are significantly higher.The industry largely expects this <strong>and</strong> does its best to maintain adequate reserves <strong>and</strong> loss-prevention programs.The industry is caught unawares, however, by an equally large number of losses from relatively “small-scale” orgradual events that are not captured by insurance monitoring systems such as Property Claims Services (whichonly tabulates losses from events causing over US $25 million in insurance claims). Data on these relatively smalllosses collected by Munich Re between 1985 <strong>and</strong> 1999 indicate that such losses are collectively equal in magnitudeto those from catastrophic events (Vellinga et al. 2001). 3 These include weather-related events such as lightningstrikes 4 (which cause fires as well as damages to electronic infrastructure), vehicle accidents from inclementweather, soil subsidence that causes insured damages to structures, local wind <strong>and</strong> hailstorms, etc. Sea level rise,<strong>change</strong>s in the patterns of infectious diseases, <strong>and</strong> the erosion of air <strong>and</strong> water quality are important classes ofgradual events <strong>and</strong> impacts, the consequences of which are also not captured by statistics on extreme events.Losses from these small-scale events grow as rapidly as those for catastrophic events, with disproportionately moreimpact on primary insurers than on reinsurers (who commonly offer only “excess” layers of coverage beyond acontractually agreed trigger level).1Source: Munich Re NatCatService.2This is generally consistent with the global projection made by the UNEP-Finance Initiative <strong>and</strong> Innovest (2002), <strong>and</strong> by the Association ofBritish Insurers (2004) for the UK.3Even this estimate is conservative, as not all losses are captured by this more inclusive approach.4Lightning has been cited as responsible for insurance (presumably property) claims (Kithil 1995), but estimates vary widely. St. Paul InsuranceCo. reported paying an average 5% of US $332 million in lightning-related claims annually between 1992 <strong>and</strong> 1996 (Kithil 2000). Theportion of these costs that are related to electricity disturbances is not known. One report from the Department of Energy states that of thelightning-related losses experienced at its own facilities, 80% were due to voltage surges (Kithil 2000). Hartford Steam Boiler Insurance &Inspection Co. has observed that claims are far more common during warm periods. This is corroborated by Schultz (1999). In addition tothese losses, lightning strikes are responsible for 85% of the area burned by wildfires (Kovacs 2001).
- Page 1 and 2:
Climate Change FuturesHealth, Ecolo
- Page 4 and 5:
Table of ContentsIntroductionPart I
- Page 6 and 7:
EXECUTIVE SUMMARYClimate is the con
- Page 8 and 9:
the past decade, an increasing prop
- Page 10 and 11:
THE CASE STUDIES IN BRIEFInfectious
- Page 12 and 13:
THE INSURER’S OVERVIEW:A UNIQUE P
- Page 14:
Regulators and governments can empl
- Page 17 and 18:
THE PROBLEM:CLIMATE IS CHANGING, FA
- Page 19 and 20:
Figure 1.3 GreenlandEXTREMESOne of
- Page 21 and 22:
20 | THE CLIMATE CONTEXT TODAYWholl
- Page 23 and 24:
Figure 1.5 Global Weather-Related L
- Page 25 and 26:
Climate signals in rising costs fro
- Page 27 and 28:
CLIMATE CHANGE CANOCCUR ABRUPTLYPer
- Page 29 and 30:
28 | THE CLIMATE CONTEXT TODAYCCF-I
- Page 31 and 32:
communities, salinizing ground wate
- Page 33 and 34:
Health is the final common pathway
- Page 35 and 36:
34 | INFECTIOUS AND RESPIRATORY DIS
- Page 37 and 38:
Figure 2.4 Malaria and Floods in Mo
- Page 39 and 40:
Figure 2.61920-1980CASE STUDIES38 |
- Page 41 and 42:
A MALARIA SUCCESSThe New York Times
- Page 43 and 44:
A new flavivirus, Usutu, akin to WN
- Page 45 and 46:
44 | INFECTIOUS AND RESPIRATORY DIS
- Page 47 and 48:
One analysis (Vanderhoof and Vander
- Page 49 and 50:
BIODIVERSITYBUFFERS AGAINSTTHE SPRE
- Page 51 and 52:
Figure 2.15 RagweedMOLDSLong-term f
- Page 53 and 54:
ASTHMA COSTSTODAYexamples, the Afri
- Page 55 and 56:
Stott et al. (2004) calculate that
- Page 57 and 58:
In the summer of 2005, northern Spa
- Page 59 and 60:
a better understanding of subpopula
- Page 61 and 62:
60 | EXTREME WEATHER EVENTSFLOODSFO
- Page 63 and 64:
MOSQUITO- AND SOIL-BORNE DISEASESEC
- Page 65 and 66: Table 2.2 Direct and Indirect Healt
- Page 67 and 68: HEALTH AND ECOLOGICALIMPLICATIONSOu
- Page 69 and 70: 68 | NATURAL AND MANAGED SYSTEMSCAS
- Page 71 and 72: Figure 2.27 Soybean Sudden Death Sy
- Page 73 and 74: 72 | NATURAL AND MANAGED SYSTEMSCAS
- Page 75 and 76: 74 | NATURAL AND MANAGED SYSTEMSCAS
- Page 77 and 78: 76 | NATURAL AND MANAGED SYSTEMSCAS
- Page 79 and 80: 78 | NATURAL AND MANAGED SYSTEMSTHE
- Page 81 and 82: HARMFUL ALGALBLOOMSFigure 2.32 Red
- Page 83 and 84: 82 | NATURAL AND MANAGED SYSTEMSCAS
- Page 85 and 86: CASE STUDIES 84 | NATURAL AND MANAG
- Page 87 and 88: CASE STUDIES 86 | NATURAL AND MANAG
- Page 89 and 90: CASE STUDIES 88 | NATURAL AND MANAG
- Page 91 and 92: CASE STUDIES 90 | NATURAL AND MANAG
- Page 93 and 94: “Climate change is one of the wor
- Page 95 and 96: 94 | FINANCIAL IMPLICATIONS• Incr
- Page 97 and 98: Extreme weather events are a partic
- Page 99 and 100: 98 | FINANCIAL IMPLICATIONSTable 3.
- Page 101 and 102: 100 | FINANCIAL IMPLICATIONSdemand
- Page 103 and 104: 102 | FINANCIAL IMPLICATIONSClimate
- Page 105 and 106: These include:Solar Photovoltaic Pa
- Page 107 and 108: • Social and economic factors in
- Page 109 and 110: Finally, new technologies need to b
- Page 111 and 112: 110 | FINANCIAL IMPLICATIONSBRETTON
- Page 113: 112 | APPENDICESAppendix A. Summary
- Page 118 and 119: Climate sensitivity for small-scale
- Page 120 and 121: diffuse and do not manifest in sing
- Page 122 and 123: APPENDIX D.LIST OF PARTICIPANTS ATT
- Page 124: Carmenza RobledoGruppe OekologieEMP
- Page 127 and 128: 126 | BIBLIOGRAPHYBibliographyAAAAI
- Page 129 and 130: 128 | BIBLIOGRAPHYChordas, L. Epide
- Page 131 and 132: Ford, S.E. & Tripp, M.R. Diseases a
- Page 133 and 134: 132 | BIBLIOGRAPHYKalkstein, L. S.,
- Page 135 and 136: 134 | BIBLIOGRAPHYMills, E. The ins
- Page 137 and 138: 136 | BIBLIOGRAPHYRose, J. B., Epst
- Page 139 and 140: 138 | BIBLIOGRAPHYVandyk, J. K., Ba
- Page 142: Infectious and Respiratory Diseases