THE ROLE OF CLIMATEAustralia experiences a wide range of climatic conditions,varying from the tropical north to the temperatesouth, <strong>and</strong> is one of the continents most affected bythe El Niño/Southern Oscillation (ENSO) phenomenon,which also influences the occurrence of heatwaves (Bureau of Meteorology 2003). Heat waveshave caused more fatalities during the 20th century inAustralia than any other natural weather hazard (EMA2003).impacts of heat (Katsouyanni et al. 1993; Rainham etal. 2003; Sartor 1994). If (perhaps unusually) thehypothetical extreme heat wave in urban New SouthWales were not accompanied by increased air pollution,the expected impact on mortality would be less<strong>and</strong> our figures accord with the incremental risks seenat the high temperature end of the temperature-mortalitydose-response curves previously published for varioustemperate-zone cities (Hales et al. 2000; Huynenet al. 2001; Hajat et al. 20002; Pattenden et al.2003).While heat waves are not infrequent in Australia,recent extreme climate occurrences suggest that, asglobal warming proceeds, we will face more frequent<strong>and</strong> extreme hot days. Globally, June 2003 saw thesecond highest l<strong>and</strong> temperatures (0.96°C above thelong term mean) being recorded (NCDC 2003). In2002, South Australia recorded the highest ever maximumsummer temperatures (Bureau of Meteorology2002). Meanwhile, analysis of daily temperaturerecords from the Commonwealth Bureau ofMeteorology for Sydney airport for the period1964–2002 indicates that there has been a modestupward trend in the number of days per year withmaximum temperatures exceeding 35°C.What if Europe’s extreme summerof 2003 came to New SouthWales, Australia?Based on the 2003 French heat wave, a hypotheticalscenario was developed for urban New South Wales,which includes Sydney, Australia’s largest city <strong>and</strong> thecapital. In France, an approximate 10°C rise in temperatureover a 14-day period resulted in a 55%increase in mortality compared to the preceding year(InVS 2003). If NSW were to experience a heat-wavewith the variations from norm that France experienced,given an annual mortality rate for urban NSW of 591deaths per 100,000, <strong>and</strong> a population of approximately5,200,000, we estimate an overall excess of647 deaths over <strong>and</strong> above the 1,176 deaths otherwiseexpected in urban NSW during a 14-day period.The August 2003 mortality excess in France, especiallyin urban areas, was amplified by coexistent highlevels of photochemical ozone (Fiala et al. 2003).Ozone, while shown to increase deaths from cardiorespiratorydisease (Simpson et al. 1997; Morgan etal. 1998a,b), has also been shown to compound theAn excess mortality within the range 25-55% would bemuch greater than that usually experienced in pastheat waves in Australia. Historically, severe heatwaves in other nearby or similar parts of the worldhave typically caused 10-20% excess deaths(Pattenden et al. 2003; Huynen et al. 2001).However, there are certain factors that are likely tocontribute to increased impacts in the present <strong>and</strong>future. For example, Australia has an aging population(AIHW 1999). With increasing numbers of elderly, theoccurrence of chronic disease <strong>and</strong> co-morbiditiesincrease. Elderly with underlying disease, particularlycardiovascular disease, <strong>and</strong> people living alone, havebeen identified as being more susceptible to theeffects of heat waves. Australia also has a high levelof urbanization, with an estimated 84.7% of the populationliving in an urban location (UNCHS 2001). Thismeans that a high proportion of the population is likelyto be exposed to air pollutants <strong>and</strong> the urban heatisl<strong>and</strong>effect. While the air quality in Australia is relativelygood by international st<strong>and</strong>ards, it is important tonote the conditions are changing. In Sydney, for example,the annual number of days on which the photochemicalozone st<strong>and</strong>ard (0.10 ppm for a one-houraverage) was exceeded has risen from zero in 1995to 19 in 2001 (NSWH 2003). This increases the susceptibilityto the impacts of heat waves.Australia is also experiencing more hot days, with predictionsthat the number of summer days over 35°C inSydney will increase from current two days up toeleven days by 2070 (CSIRO 2001). Given all thesefactors, it is not unlikely that the adverse impact of heatwaves in Australia will increase with time.59 | EXTREME WEATHER EVENTSCASE STUDIES
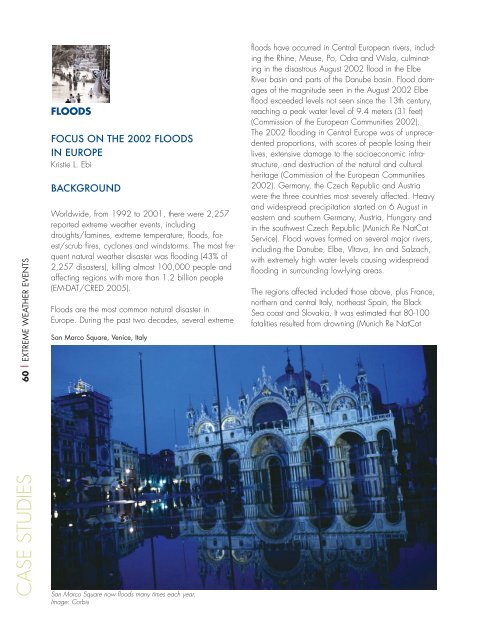
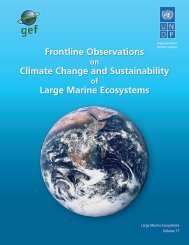
60 | EXTREME WEATHER EVENTSFLOODSFOCUS ON THE 2002 FLOODSIN EUROPEKristie L. EbiBACKGROUNDWorldwide, from 1992 to 2001, there were 2,257reported extreme weather events, includingdroughts/famines, extreme temperature, floods, forest/scrubfires, cyclones <strong>and</strong> windstorms. The most frequentnatural weather disaster was flooding (43% of2,257 disasters), killing almost 100,000 people <strong>and</strong>affecting regions with more than 1.2 billion people(EM-DAT/CRED 2005).Floods are the most common natural disaster inEurope. During the past two decades, several extremeSan Marco Square, Venice, Italyfloods have occurred in Central European rivers, includingthe Rhine, Meuse, Po, Odra <strong>and</strong> Wisla, culminatingin the disastrous August 2002 flood in the ElbeRiver basin <strong>and</strong> parts of the Danube basin. Flood damagesof the magnitude seen in the August 2002 Elbeflood exceeded levels not seen since the 13th century,reaching a peak water level of 9.4 meters (31 feet)(Commission of the European Communities 2002).The 2002 flooding in Central Europe was of unprecedentedproportions, with scores of people losing theirlives, extensive damage to the socio<strong>economic</strong> infrastructure,<strong>and</strong> destruction of the natural <strong>and</strong> culturalheritage (Commission of the European Communities2002). Germany, the Czech Republic <strong>and</strong> Austriawere the three countries most severely affected. Heavy<strong>and</strong> widespread precipitation started on 6 August ineastern <strong>and</strong> southern Germany, Austria, Hungary <strong>and</strong>in the southwest Czech Republic (Munich Re NatCatService). Flood waves formed on several major rivers,including the Danube, Elbe, Vltava, Inn <strong>and</strong> Salzach,with extremely high water levels causing widespreadflooding in surrounding low-lying areas.The regions affected included those above, plus France,northern <strong>and</strong> central Italy, northeast Spain, the BlackSea coast <strong>and</strong> Slovakia. It was estimated that 80-100fatalities resulted from drowning (Munich Re NatCatCASE STUDIESSan Marco Square now floods many times each year.Image: Corbis
- Page 1 and 2:
Climate Change FuturesHealth, Ecolo
- Page 4 and 5:
Table of ContentsIntroductionPart I
- Page 6 and 7:
EXECUTIVE SUMMARYClimate is the con
- Page 8 and 9:
the past decade, an increasing prop
- Page 10 and 11: THE CASE STUDIES IN BRIEFInfectious
- Page 12 and 13: THE INSURER’S OVERVIEW:A UNIQUE P
- Page 14: Regulators and governments can empl
- Page 17 and 18: THE PROBLEM:CLIMATE IS CHANGING, FA
- Page 19 and 20: Figure 1.3 GreenlandEXTREMESOne of
- Page 21 and 22: 20 | THE CLIMATE CONTEXT TODAYWholl
- Page 23 and 24: Figure 1.5 Global Weather-Related L
- Page 25 and 26: Climate signals in rising costs fro
- Page 27 and 28: CLIMATE CHANGE CANOCCUR ABRUPTLYPer
- Page 29 and 30: 28 | THE CLIMATE CONTEXT TODAYCCF-I
- Page 31 and 32: communities, salinizing ground wate
- Page 33 and 34: Health is the final common pathway
- Page 35 and 36: 34 | INFECTIOUS AND RESPIRATORY DIS
- Page 37 and 38: Figure 2.4 Malaria and Floods in Mo
- Page 39 and 40: Figure 2.61920-1980CASE STUDIES38 |
- Page 41 and 42: A MALARIA SUCCESSThe New York Times
- Page 43 and 44: A new flavivirus, Usutu, akin to WN
- Page 45 and 46: 44 | INFECTIOUS AND RESPIRATORY DIS
- Page 47 and 48: One analysis (Vanderhoof and Vander
- Page 49 and 50: BIODIVERSITYBUFFERS AGAINSTTHE SPRE
- Page 51 and 52: Figure 2.15 RagweedMOLDSLong-term f
- Page 53 and 54: ASTHMA COSTSTODAYexamples, the Afri
- Page 55 and 56: Stott et al. (2004) calculate that
- Page 57 and 58: In the summer of 2005, northern Spa
- Page 59: a better understanding of subpopula
- Page 63 and 64: MOSQUITO- AND SOIL-BORNE DISEASESEC
- Page 65 and 66: Table 2.2 Direct and Indirect Healt
- Page 67 and 68: HEALTH AND ECOLOGICALIMPLICATIONSOu
- Page 69 and 70: 68 | NATURAL AND MANAGED SYSTEMSCAS
- Page 71 and 72: Figure 2.27 Soybean Sudden Death Sy
- Page 73 and 74: 72 | NATURAL AND MANAGED SYSTEMSCAS
- Page 75 and 76: 74 | NATURAL AND MANAGED SYSTEMSCAS
- Page 77 and 78: 76 | NATURAL AND MANAGED SYSTEMSCAS
- Page 79 and 80: 78 | NATURAL AND MANAGED SYSTEMSTHE
- Page 81 and 82: HARMFUL ALGALBLOOMSFigure 2.32 Red
- Page 83 and 84: 82 | NATURAL AND MANAGED SYSTEMSCAS
- Page 85 and 86: CASE STUDIES 84 | NATURAL AND MANAG
- Page 87 and 88: CASE STUDIES 86 | NATURAL AND MANAG
- Page 89 and 90: CASE STUDIES 88 | NATURAL AND MANAG
- Page 91 and 92: CASE STUDIES 90 | NATURAL AND MANAG
- Page 93 and 94: “Climate change is one of the wor
- Page 95 and 96: 94 | FINANCIAL IMPLICATIONS• Incr
- Page 97 and 98: Extreme weather events are a partic
- Page 99 and 100: 98 | FINANCIAL IMPLICATIONSTable 3.
- Page 101 and 102: 100 | FINANCIAL IMPLICATIONSdemand
- Page 103 and 104: 102 | FINANCIAL IMPLICATIONSClimate
- Page 105 and 106: These include:Solar Photovoltaic Pa
- Page 107 and 108: • Social and economic factors in
- Page 109 and 110: Finally, new technologies need to b
- Page 111 and 112:
110 | FINANCIAL IMPLICATIONSBRETTON
- Page 113:
112 | APPENDICESAppendix A. Summary
- Page 116 and 117:
Table B.1 Summer Percentage Frequen
- Page 118 and 119:
Climate sensitivity for small-scale
- Page 120 and 121:
diffuse and do not manifest in sing
- Page 122 and 123:
APPENDIX D.LIST OF PARTICIPANTS ATT
- Page 124:
Carmenza RobledoGruppe OekologieEMP
- Page 127 and 128:
126 | BIBLIOGRAPHYBibliographyAAAAI
- Page 129 and 130:
128 | BIBLIOGRAPHYChordas, L. Epide
- Page 131 and 132:
Ford, S.E. & Tripp, M.R. Diseases a
- Page 133 and 134:
132 | BIBLIOGRAPHYKalkstein, L. S.,
- Page 135 and 136:
134 | BIBLIOGRAPHYMills, E. The ins
- Page 137 and 138:
136 | BIBLIOGRAPHYRose, J. B., Epst
- Page 139 and 140:
138 | BIBLIOGRAPHYVandyk, J. K., Ba
- Page 142:
Infectious and Respiratory Diseases