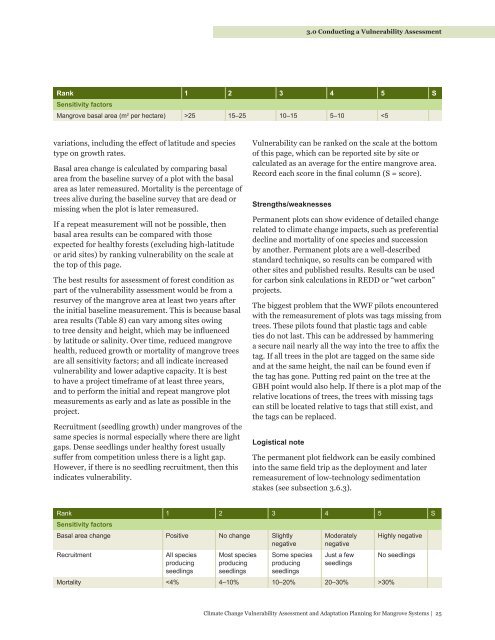
3.0 Conducting a <strong>Vulnerability</strong> <strong>Assessment</strong>Biomass of the tree, plot <strong>and</strong> per hectare, can bedetermined by the use of allometric equations whichhave been derived experimentally from harvestingan area <strong>and</strong> by determining dry weight. There areequations available in the literature for mangrovetrees of different statures (Putz & Chan, 1986; Clough& Scott, 1989; Clough, 1992; Clough et al., 1997;Komiyama et al., 2008). This biomass conversion isnot required for a mangrove vulnerability assessment,but it demonstrates that these field data can be usedto assist with carbon sink calculations that may beuseful for mangrove REDD (Reducing Emissions fromDeforestation <strong>and</strong> Forest Degradation) or “wet carbon”projects.How to interpret vulnerabilityThe results of tree density, relative frequency, meanDBH, mean height, basal area <strong>and</strong> relative dominancecalculations can be interpreted by• comparison between plots across a transect• comparison from a transect at one site to atransect at another site• comparison over time, as shown in the case studybelow• comparison of results with published data frommangrove plot measurement that also uses thesest<strong>and</strong>ard methods (Saenger & Snedaker, 1993;Devoe & Cole, 1998; Soares & Schaeffer-Novelli,2005; Krauss et al., 2006; Bouillon et al., 2008;Komiyama et al., 2008; Cavalcanti et al., 2009;Kauffman et al., 2011).Some mangrove forest structure data (Komiyamaet al., 2008; Cavalcanti et al., 2009; Kauffman et al.2011) reveal considerable differences in basal area perhectare across mangrove forests that reflect varyinglevels of human or natural disturbance impact.Although these studies were not designed to assessvulnerability as shown by basal area, they do includeuseful basal area data that are indicative of forestconditions. These have been compiled to produce ageneral indicator scale of forest condition (Table 8).From these studies, three levels of impact could bediscerned without over-extrapolating the data, <strong>and</strong>the basal area for each show considerable differences,although statistical analysis was impeded by lack ofprimary data. The WWF pilot in the Douala Estuary,Cameroon, that focused on different scales of exploitedforest showed that this comparison is a useful way ofinterpreting forest condition. However, there will beSource Location What wasmeasuredKomiyama et al., 2008 Global, 54locationsBA m 2 per ha 25.3n=15Forest condition1 2 315.2n= 69.8n=4CommentsReview of other studiesCavalcanti et al., 2009Guanabara Bay,BrazilBA m 2 per hamean16.0±3.913.2±4.9Pellegrini 2000 & Chaves2001 in Cavalcanti et al.,2009Sepetiba Bay,BrazilBA m 2 per harange11.6-61.7Broad BA range attributed togood state of conservationbut strong human influencepersistingSoares 1999 inCavalcanti et al., 2009Tijuca Lagoon,BrazilBA m 2 per harange13.3–41.4Kauffman et al., 2011 Palau MeanBA m 2 per haacross zones34–43 Forest condition understoodto be near-pristineAjonina et al., 2011Yap 41–78Douala,CameroonBA m 2 per hamean31.1 10.3 3.9 WWF pilot site, CameroonTable 8. Compilation of basal area data relative to reported forest condition. Forest condition categories are:1: minimal impact with traditional use, good conservation, pristine or primary forest; 2: managed or having someconservation status, or secondary forest; 3: affected by natural or anthropogenic disturbance, or concession forest.24 | <strong>Climate</strong> <strong>Change</strong> <strong>Vulnerability</strong> <strong>Assessment</strong> <strong>and</strong> <strong>Adaptation</strong> <strong>Planning</strong> for Mangrove Systems
3.0 Conducting a <strong>Vulnerability</strong> <strong>Assessment</strong>Rank 1 2 3 4 5 SSensitivity factorsMangrove basal area (m 2 per hectare) >25 15–25 10–15 5–10
- Page 2 and 3: © 2012 WWFISBN: 978-92-990069-0-0R
- Page 4 and 5: © naturepl.com/Tim Laman/WWF
- Page 6: Table of Contents, Figures8.0 Gloss
- Page 12 and 13: Photo: Monifa Fiu
- Page 16 and 17: 1.0 Mangroves: Values, Status and T
- Page 20: 2.0 Planning a Vulnerability Assess
- Page 26 and 27: 3.0 Conducting a Vulnerability Asse
- Page 32: 3.0 Conducting a Vulnerability Asse
- Page 40 and 41: 3.0 Conducting a Vulnerability Asse
- Page 42: 3.0 Conducting a Vulnerability Asse
- Page 46 and 47: 3.0 Conducting a Vulnerability Asse
- Page 49: 3.0 Conducting a Vulnerability Asse
- Page 56 and 57: 3.0 Conducting a Vulnerability Asse
- Page 59: 3.0 Conducting a Vulnerability Asse
- Page 64: 3.0 Conducting a Vulnerability Asse
- Page 67 and 68: 3.0 Conducting a Vulnerability Asse
- Page 71: 3.0 Conducting a Vulnerability Asse
- Page 75 and 76: 3.0 Conducting a Vulnerability Asse
- Page 77: 3.0 Conducting a Vulnerability Asse
- Page 80 and 81: 3.0 Conducting a Vulnerability Asse
- Page 82 and 83: 3.0 Conducting a Vulnerability Asse
- Page 84 and 85: 3.0 Conducting a Vulnerability Asse
- Page 86 and 87:
3.0 Conducting a Vulnerability Asse
- Page 88 and 89:
3.0 Conducting a Vulnerability Asse
- Page 90 and 91:
3.0 Conducting a Vulnerability Asse
- Page 92 and 93:
4.0 Interpreting a Mangrove Vuneral
- Page 94 and 95:
4.0 Interpreting a Mangrove Vuneral
- Page 96 and 97:
4.0 Interpreting a Mangrove Vuneral
- Page 98:
5.0 Developing Adaptation MeasuresT
- Page 102 and 103:
5.0 Developing Adaptation Measures5
- Page 104 and 105:
5.0 Developing Adaptation Measureso
- Page 106 and 107:
5.0 Developing Adaptation Measures5
- Page 109 and 110:
5.0 Developing Adaptation MeasuresF
- Page 111 and 112:
5.0 Developing Adaptation MeasuresF
- Page 114 and 115:
5.0 Developing Adaptation Measures5
- Page 116 and 117:
6.0 ConclusionsClimate change, part
- Page 118 and 119:
7.0 ReferencesBosire, J. O., Dahdou
- Page 120 and 121:
7.0 ReferencesForbes, A. T., & Cyru
- Page 122 and 123:
7.0 ReferencesKovacs, J. M., Wang,
- Page 124 and 125:
7.0 ReferencesRogers, K., Saintilan
- Page 126 and 127:
8.0 GlossaryAbscission collar A reg
- Page 128 and 129:
8.0 GlossaryLiDAR Light Detection a
- Page 130 and 131:
Photo: Rob Anders
- Page 132 and 133:
Appendix: Data Sheets120 | Climate
- Page 134 and 135:
Appendix: Data Sheets122 | Climate
- Page 136 and 137:
Appendix: Data SheetsData sheet for
- Page 138 and 139:
Appendix: Data Sheets126 | Climate
- Page 140:
Appendix: Data Sheets128 | Climate