3.0 Conducting a <strong>Vulnerability</strong> <strong>Assessment</strong>on algae <strong>and</strong> have different impacts on its growth<strong>and</strong> spreading) is measured.6. Resilience indicators are factors that affect theresistance of corals to bleaching <strong>and</strong> the resilienceor recovery potential of the reef community. Abroad range of indicators in different classes ismeasured, some quantitatively <strong>and</strong> some by eyeestimates.This methodology has already been applied in 25different areas globally (Obura, 2010), establishinga st<strong>and</strong>ardized method for assessing coral reefvulnerability to climate change. It is summarizedfurther in Table 20.A semi-quantitative five-point scale is used forestimating most of the indicators (Obura & Grimsditch,2009; Obura, 2010), except for those (like temperature<strong>and</strong> visibility) that could easily be measured orestimated quantitatively. Classification of the five-pointscale is done using local <strong>and</strong> regional knowledge.How to interpret vulnerabilityWhere adjacent coral reefs are in poor condition,mangroves have reduced sediment supply fromoffshore productivity, reduced protection from waveaction <strong>and</strong> reduced quality of adjacent habitats used bymangrove species such as fish. Hence, reduced qualityof adjacent coral reefs increases the sensitivity ofmangroves to climate change impacts.Rank vulnerability on the scale at the top of the nextpage, either site by site or calculated as an averagefor the area. The semi-quantitative five-point scale ofObura & Grimsditch (2009) <strong>and</strong> the resilience scale ofComponent Method/approach Equipment required1 Benthic cover Compatible with st<strong>and</strong>ard long-term monitoring approaches.Uses point transects.2 Coral community structure(genera)Visual estimate — relative abundance of genera at the study site,in 5 classes:5 = dominant4 = abundant3 = common2 = uncommon1 = rareGenus guide for coralsData sheets — benthic, fish,invertebrates3 Coral size class distributions(selected genera)*Belt transects (25 x 1 m, four replicates) with sub-sampling usingquadrats for colonies > 10 cm. 15–20 selected genera, in doublingsize classes (0–2.5, 3–5, 6–10, 11–20 cm, etc.)4 Coral condition Incidence of coral bleaching, disease, other conditions <strong>and</strong>mortality in the size distribution belt transects <strong>and</strong> in the generalstudy site.5 Fish community structure —herbivoresLong-swim <strong>and</strong> belt transects (50 x 5 m, three replicates)recording incidence of large indicator fish <strong>and</strong> main functionalgroups, focusing on herbivore functional groups1 m ruler/stick marked at 10,20, 40 <strong>and</strong> 80 cm to help guidesize estimates (3/4” PVC tubeideal for this)Benthic data sheet, CoralWatch coral health chart50 m line transect, data sheetwith ID sheet of main groups6 Resistance <strong>and</strong> resilienceindicatorsVisual estimation (e.g., slope) or 5-point scale of resistance <strong>and</strong>resilience indicators across multiple factors:• benthic cover• physical site parameters• substrate <strong>and</strong> reef morphology• cooling <strong>and</strong> flushing• shading <strong>and</strong> screening• extreme conditions <strong>and</strong> acclimatization, coral condition• coral population structure <strong>and</strong> coral associates• fish functional groups (herbivory)• connectivity <strong>and</strong> anthropogenic conditionsTable 20. Summary of the resilience assessment for coral reefs (Obura & Grimsditch, 2009; Obura, 2010).68 | <strong>Climate</strong> <strong>Change</strong> <strong>Vulnerability</strong> <strong>Assessment</strong> <strong>and</strong> <strong>Adaptation</strong> <strong>Planning</strong> for Mangrove Systems
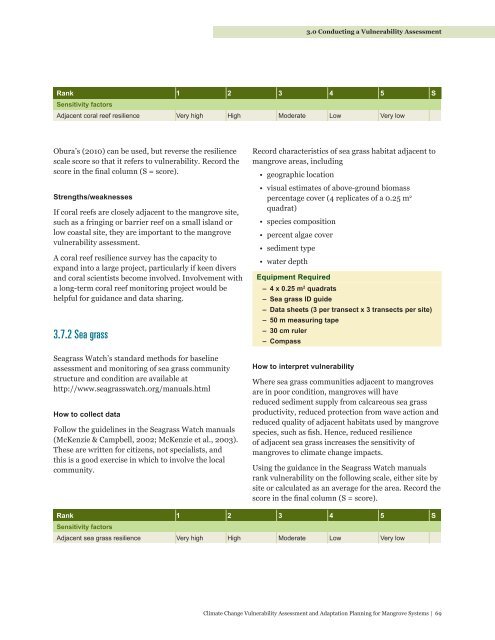
3.0 Conducting a <strong>Vulnerability</strong> <strong>Assessment</strong>Rank 1 2 3 4 5 SSensitivity factorsAdjacent coral reef resilience Very high High Moderate Low Very lowObura’s (2010) can be used, but reverse the resiliencescale score so that it refers to vulnerability. Record thescore in the final column (S = score).Strengths/weaknessesIf coral reefs are closely adjacent to the mangrove site,such as a fringing or barrier reef on a small isl<strong>and</strong> orlow coastal site, they are important to the mangrovevulnerability assessment.A coral reef resilience survey has the capacity toexp<strong>and</strong> into a large project, particularly if keen divers<strong>and</strong> coral scientists become involved. Involvement witha long-term coral reef monitoring project would behelpful for guidance <strong>and</strong> data sharing.3.7.2 Sea grassSeagrass Watch’s st<strong>and</strong>ard methods for baselineassessment <strong>and</strong> monitoring of sea grass communitystructure <strong>and</strong> condition are available athttp://www.seagrasswatch.org/manuals.htmlHow to collect dataFollow the guidelines in the Seagrass Watch manuals(McKenzie & Campbell, 2002; McKenzie et al., 2003).These are written for citizens, not specialists, <strong>and</strong>this is a good exercise in which to involve the localcommunity.Record characteristics of sea grass habitat adjacent tomangrove areas, including• geographic location• visual estimates of above-ground biomasspercentage cover (4 replicates of a 0.25 m 2quadrat)• species composition• percent algae cover• sediment type• water depthEquipment Required– 4 x 0.25 m 2 quadrats– Sea grass ID guide– Data sheets (3 per transect x 3 transects per site)– 50 m measuring tape– 30 cm ruler– CompassHow to interpret vulnerabilityWhere sea grass communities adjacent to mangrovesare in poor condition, mangroves will havereduced sediment supply from calcareous sea grassproductivity, reduced protection from wave action <strong>and</strong>reduced quality of adjacent habitats used by mangrovespecies, such as fish. Hence, reduced resilienceof adjacent sea grass increases the sensitivity ofmangroves to climate change impacts.Using the guidance in the Seagrass Watch manualsrank vulnerability on the following scale, either site bysite or calculated as an average for the area. Record thescore in the final column (S = score).Rank 1 2 3 4 5 SSensitivity factorsAdjacent sea grass resilience Very high High Moderate Low Very low<strong>Climate</strong> <strong>Change</strong> <strong>Vulnerability</strong> <strong>Assessment</strong> <strong>and</strong> <strong>Adaptation</strong> <strong>Planning</strong> for Mangrove Systems | 69
- Page 2 and 3:
© 2012 WWFISBN: 978-92-990069-0-0R
- Page 4 and 5:
© naturepl.com/Tim Laman/WWF
- Page 6:
Table of Contents, Figures8.0 Gloss
- Page 12 and 13:
Photo: Monifa Fiu
- Page 16 and 17:
1.0 Mangroves: Values, Status and T
- Page 20:
2.0 Planning a Vulnerability Assess
- Page 26 and 27:
3.0 Conducting a Vulnerability Asse
- Page 32: 3.0 Conducting a Vulnerability Asse
- Page 36 and 37: 3.0 Conducting a Vulnerability Asse
- Page 40 and 41: 3.0 Conducting a Vulnerability Asse
- Page 42: 3.0 Conducting a Vulnerability Asse
- Page 46 and 47: 3.0 Conducting a Vulnerability Asse
- Page 49: 3.0 Conducting a Vulnerability Asse
- Page 56 and 57: 3.0 Conducting a Vulnerability Asse
- Page 59: 3.0 Conducting a Vulnerability Asse
- Page 64: 3.0 Conducting a Vulnerability Asse
- Page 67 and 68: 3.0 Conducting a Vulnerability Asse
- Page 71: 3.0 Conducting a Vulnerability Asse
- Page 75 and 76: 3.0 Conducting a Vulnerability Asse
- Page 77: 3.0 Conducting a Vulnerability Asse
- Page 82 and 83: 3.0 Conducting a Vulnerability Asse
- Page 84 and 85: 3.0 Conducting a Vulnerability Asse
- Page 86 and 87: 3.0 Conducting a Vulnerability Asse
- Page 88 and 89: 3.0 Conducting a Vulnerability Asse
- Page 90 and 91: 3.0 Conducting a Vulnerability Asse
- Page 92 and 93: 4.0 Interpreting a Mangrove Vuneral
- Page 94 and 95: 4.0 Interpreting a Mangrove Vuneral
- Page 96 and 97: 4.0 Interpreting a Mangrove Vuneral
- Page 98: 5.0 Developing Adaptation MeasuresT
- Page 102 and 103: 5.0 Developing Adaptation Measures5
- Page 104 and 105: 5.0 Developing Adaptation Measureso
- Page 106 and 107: 5.0 Developing Adaptation Measures5
- Page 109 and 110: 5.0 Developing Adaptation MeasuresF
- Page 111 and 112: 5.0 Developing Adaptation MeasuresF
- Page 114 and 115: 5.0 Developing Adaptation Measures5
- Page 116 and 117: 6.0 ConclusionsClimate change, part
- Page 118 and 119: 7.0 ReferencesBosire, J. O., Dahdou
- Page 120 and 121: 7.0 ReferencesForbes, A. T., & Cyru
- Page 122 and 123: 7.0 ReferencesKovacs, J. M., Wang,
- Page 124 and 125: 7.0 ReferencesRogers, K., Saintilan
- Page 126 and 127: 8.0 GlossaryAbscission collar A reg
- Page 128 and 129: 8.0 GlossaryLiDAR Light Detection a
- Page 130 and 131:
Photo: Rob Anders
- Page 132 and 133:
Appendix: Data Sheets120 | Climate
- Page 134 and 135:
Appendix: Data Sheets122 | Climate
- Page 136 and 137:
Appendix: Data SheetsData sheet for
- Page 138 and 139:
Appendix: Data Sheets126 | Climate
- Page 140:
Appendix: Data Sheets128 | Climate