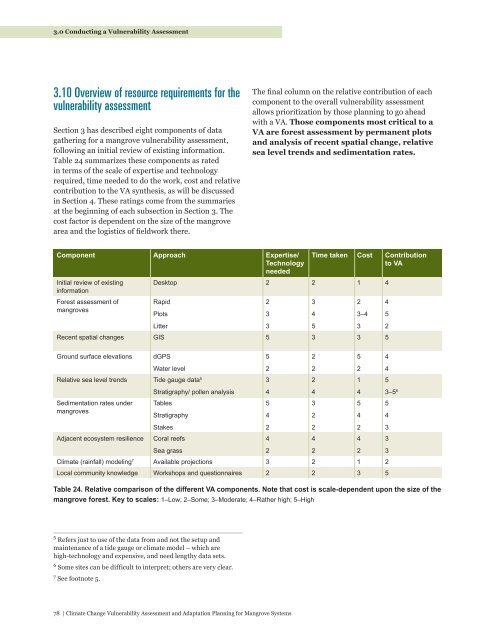
3.0 Conducting a <strong>Vulnerability</strong> <strong>Assessment</strong>3.10 Overview of resource requirements for thevulnerability assessmentSection 3 has described eight components of datagathering for a mangrove vulnerability assessment,following an initial review of existing information.Table 24 summarizes these components as ratedin terms of the scale of expertise <strong>and</strong> technologyrequired, time needed to do the work, cost <strong>and</strong> relativecontribution to the VA synthesis, as will be discussedin Section 4. These ratings come from the summariesat the beginning of each subsection in Section 3. Thecost factor is dependent on the size of the mangrovearea <strong>and</strong> the logistics of fieldwork there.The final column on the relative contribution of eachcomponent to the overall vulnerability assessmentallows prioritization by those planning to go aheadwith a VA. Those components most critical to aVA are forest assessment by permanent plots<strong>and</strong> analysis of recent spatial change, relativesea level trends <strong>and</strong> sedimentation rates.Component Approach Expertise/TechnologyneededInitial review of existinginformationForest assessment ofmangrovesTime taken Cost Contributionto VADesktop 2 2 1 4RapidPlotsLitterRecent spatial changes GIS 5 3 3 5Ground surface elevationsdGPSWater levelRelative sea level trends Tide gauge data 5Sedimentation rates undermangrovesAdjacent ecosystem resilienceStratigraphy/ pollen analysisTablesStratigraphyStakesCoral reefsSea grass<strong>Climate</strong> (rainfall) modeling 7 Available projections 3 2 1 2Local community knowledge Workshops <strong>and</strong> questionnaires 2 2 3 5Table 24. Relative comparison of the different VA components. Note that cost is scale-dependent upon the size of themangrove forest. Key to scales: 1–Low; 2–Some; 3–Moderate; 4–Rather high; 5–High23352345424234522243224223–435214542424524453–5 6543335 Refers just to use of the data from <strong>and</strong> not the setup <strong>and</strong>maintenance of a tide gauge or climate model – which arehigh-technology <strong>and</strong> expensive, <strong>and</strong> need lengthy data sets.6 Some sites can be difficult to interpret; others are very clear.7 See footnote 5.78 | <strong>Climate</strong> <strong>Change</strong> <strong>Vulnerability</strong> <strong>Assessment</strong> <strong>and</strong> <strong>Adaptation</strong> <strong>Planning</strong> for Mangrove Systems
4.0 Interpreting a <strong>Vulnerability</strong> <strong>Assessment</strong>This section explains how to combine results fromsome or all of the eight components described inSection 3 to obtain an overall vulnerability assessmentfor a given mangrove area. The information mustbe synthesized to identify levels of resilience orvulnerability. From this synthesis, appropriateadaptation actions, which are described in Section 5,can be identified <strong>and</strong> prioritized.<strong>Vulnerability</strong> is a function of exposure, sensitivity <strong>and</strong>adaptive capacity (Figure 4). The reduction of exposure<strong>and</strong> sensitivity also contributes to greater adaptivecapacity. The eight components outlined in Section3 allow the assessment of sensitivity, exposure <strong>and</strong>adaptive capacity for a given mangrove area. Note thatimpact identification indicates any sensitivity to date.<strong>Vulnerability</strong> is not an absolute quantitativecharacteristic. It is a relative, non-measurable,dimensionless property (Stigter et al., 2006).<strong>Vulnerability</strong> of ecosystems to individual threats hasbeen ranked for a number of ecosystems throughsurveys of relevant experts (Halpern et al., 2007;Halpern et al., 2008; Selcoe et al., 2009; Teck et al.,2010; Fuentes et al., 2011; Grech et al., 2011). Theseonline surveys were sometimes impressionistic.For example, the risk of exposure of turtle breedinggrounds in Queensl<strong>and</strong>, Australia, to sea level risewas ranked as “never occurs/occasionally/often orconstant” by sea turtle experts (Fuentes et al., 2011),though the survey did not refer to specific sea levelchange or tide gauge data.Such online surveys of expert opinion do notpractically suit a site-based vulnerability assessment,where risk assessment data are used to guide onthe-groundplanning <strong>and</strong> management. A riskranking system, however, could identify aspectsof the mangrove forest system most susceptible todisturbance under a changing climate (Dale et al.,2001).4.1 Ranking the resultsGuidance is given throughout Section 3 on how torank the results from each VA component using afive-point scale. The “How to analyze results” <strong>and</strong>“How to interpret vulnerability” subsections undereach component can be used to determine a rank scorethat goes into the last column (S = score). In somecases, that number comes directly from the assessmentmethod; for instance, in the mangrove conditionassessment, the scores are determined using Table 6.To obtain an overall mangrove vulnerabilityassessment ranking, the scores assigned for each ofthe eight components in Section 3 should be collatedinto a single table, as shown in Table 25. The table isdivided into exposure, sensitivity <strong>and</strong> adaptive capacityfactors. Tidal range, relative sea level trends, sedimentsupply rates <strong>and</strong> precipitation change are all exposurefactors, while sensitivity factors include the majority ofmeasured factors, such as forest condition <strong>and</strong> growth.Availability of migration areas inl<strong>and</strong> from mangroves,community management capacity <strong>and</strong> degree ofstakeholder involvement in mangrove management areadaptive capacity factors.To obtain the overall score for a given site, add up thescores recorded in the final S column <strong>and</strong> fill in thetotal at the bottom of the table. Then divide by thenumber of completed components of the VA (e.g., thenumber of rows that were filled in). Some studies willnot be able to complete all components of the VA, dueto limited budgets or other factors – for example, amangrove site may not have adjacent coral reefs or seagrass.<strong>Climate</strong> <strong>Change</strong> <strong>Vulnerability</strong> <strong>Assessment</strong> <strong>and</strong> <strong>Adaptation</strong> <strong>Planning</strong> for Mangrove Systems | 79
- Page 2 and 3:
© 2012 WWFISBN: 978-92-990069-0-0R
- Page 4 and 5:
© naturepl.com/Tim Laman/WWF
- Page 6:
Table of Contents, Figures8.0 Gloss
- Page 12 and 13:
Photo: Monifa Fiu
- Page 16 and 17:
1.0 Mangroves: Values, Status and T
- Page 20:
2.0 Planning a Vulnerability Assess
- Page 26 and 27:
3.0 Conducting a Vulnerability Asse
- Page 32:
3.0 Conducting a Vulnerability Asse
- Page 36 and 37:
3.0 Conducting a Vulnerability Asse
- Page 40 and 41: 3.0 Conducting a Vulnerability Asse
- Page 42: 3.0 Conducting a Vulnerability Asse
- Page 46 and 47: 3.0 Conducting a Vulnerability Asse
- Page 49: 3.0 Conducting a Vulnerability Asse
- Page 56 and 57: 3.0 Conducting a Vulnerability Asse
- Page 59: 3.0 Conducting a Vulnerability Asse
- Page 64: 3.0 Conducting a Vulnerability Asse
- Page 67 and 68: 3.0 Conducting a Vulnerability Asse
- Page 71: 3.0 Conducting a Vulnerability Asse
- Page 75 and 76: 3.0 Conducting a Vulnerability Asse
- Page 77: 3.0 Conducting a Vulnerability Asse
- Page 80 and 81: 3.0 Conducting a Vulnerability Asse
- Page 82 and 83: 3.0 Conducting a Vulnerability Asse
- Page 84 and 85: 3.0 Conducting a Vulnerability Asse
- Page 86 and 87: 3.0 Conducting a Vulnerability Asse
- Page 88 and 89: 3.0 Conducting a Vulnerability Asse
- Page 92 and 93: 4.0 Interpreting a Mangrove Vuneral
- Page 94 and 95: 4.0 Interpreting a Mangrove Vuneral
- Page 96 and 97: 4.0 Interpreting a Mangrove Vuneral
- Page 98: 5.0 Developing Adaptation MeasuresT
- Page 102 and 103: 5.0 Developing Adaptation Measures5
- Page 104 and 105: 5.0 Developing Adaptation Measureso
- Page 106 and 107: 5.0 Developing Adaptation Measures5
- Page 109 and 110: 5.0 Developing Adaptation MeasuresF
- Page 111 and 112: 5.0 Developing Adaptation MeasuresF
- Page 114 and 115: 5.0 Developing Adaptation Measures5
- Page 116 and 117: 6.0 ConclusionsClimate change, part
- Page 118 and 119: 7.0 ReferencesBosire, J. O., Dahdou
- Page 120 and 121: 7.0 ReferencesForbes, A. T., & Cyru
- Page 122 and 123: 7.0 ReferencesKovacs, J. M., Wang,
- Page 124 and 125: 7.0 ReferencesRogers, K., Saintilan
- Page 126 and 127: 8.0 GlossaryAbscission collar A reg
- Page 128 and 129: 8.0 GlossaryLiDAR Light Detection a
- Page 130 and 131: Photo: Rob Anders
- Page 132 and 133: Appendix: Data Sheets120 | Climate
- Page 134 and 135: Appendix: Data Sheets122 | Climate
- Page 136 and 137: Appendix: Data SheetsData sheet for
- Page 138 and 139: Appendix: Data Sheets126 | Climate
- Page 140:
Appendix: Data Sheets128 | Climate