3.0 Conducting a <strong>Vulnerability</strong> <strong>Assessment</strong>3.8 <strong>Climate</strong> (rainfall) modelingApproach Expertise/ Technology needed Time taken Cost Contribution to VAAvailable projections Moderate Some Low 3 SomeWhat is it?This method involves a review of detailed projectionsfor climate change effects on rainfall for the mangrovearea <strong>and</strong> for the catchment areas of any riversdelivering surface water to the mangrove area, usingglobal models <strong>and</strong>/or downscaled regional modelswhere available (these give a higher-resolution outputthan global models).<strong>Climate</strong> change, particularly with respect to rainfall<strong>and</strong> humidity changes, is an exposure factor.Why do it?The predicted effects of climate change factors onmangrove ecosystems listed in Table 1 show thatmangroves are not expected to be vulnerable toincreased temperatures, increased CO 2 concentrations,or wetter conditions. One exception is where extremeevents bring prolonged flooding, which causesmangrove mortality (Breen & Hill, 1969; Jimenez &Lugo, 1985; Steinke & Ward, 1989; Forbes & Cyrus,1992; Choy & Booth, 1994; Erftemeijer & Hamerlynck,2005).Reduced rainfall <strong>and</strong> reduced humidity, however, havea negative effect on mangrove productivity (Table 1),but given that productive mangroves exist in some ofthe driest areas on Earth (Ellison & Simmonds, 2003),these occurrences are unlikely to cause their total loss.As the precipitation projections in climate changemodels improve, such modeling will become moreuseful for a mangrove vulnerability assessment.How to collect dataAs discussed in subsection 3.1, modeled data offuture climate change scenarios may be available forthe vulnerability assessment area through partners,stakeholders or other projects. Key stakeholdersto approach are meteorological agencies, focalgovernment departments responsible for climatechange or regional climate change institutions.In many cases, such downscaled modeling outputs maynot be available from secondary sources, in which casethey can be commissioned from specialist institutionswith modeling expertise, such as universitiesor national meteorological agencies. However,practitioners will want to consider whether theresulting expense is the best use of available resourcesin view of the uncertainty <strong>and</strong> unpredictabilitycurrently involved in generating future rainfallprojections. The value of downscaled projections willalso depend on the number of meteorological stationsin the vicinity of the target area <strong>and</strong> the temporal spanof the data, which poses a limitation particularly insub-Saharan Africa.How to analyze resultsUse model results to analyze different rainfallparameters relative to recent conditions such as:• mean monthly rainfall• mean daily rainfall• monthly 90th percentile daily rainfall• monthly days exceeding 90th percentile• monthly mean dry spell durationA significant increase in drier conditions may causereduced productivity <strong>and</strong> diversity in mangrovesor at riverine sites <strong>and</strong> in the usually more diversel<strong>and</strong>ward margins of mangroves. Species suchas Avicennia bicolor, Sonneratia caseolaris, S.lanceolata, Rhizophora racemosa, Pelliciera sp. (Dukeet al., 1998) <strong>and</strong> Nypa fruticans are upstream speciesof freshwater-dominated riverine systems that areparticularly vulnerable to increases in salinity causedby drier conditions.3 Refers just to use of the data, not the actual setup <strong>and</strong>maintenance of a climate model – which is high-technology,expensive <strong>and</strong> requires lengthy data sets.72 | <strong>Climate</strong> <strong>Change</strong> <strong>Vulnerability</strong> <strong>Assessment</strong> <strong>and</strong> <strong>Adaptation</strong> <strong>Planning</strong> for Mangrove Systems
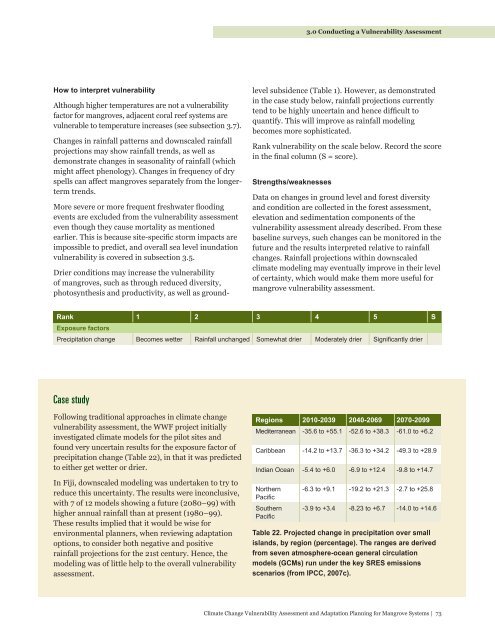
3.0 Conducting a <strong>Vulnerability</strong> <strong>Assessment</strong>How to interpret vulnerabilityAlthough higher temperatures are not a vulnerabilityfactor for mangroves, adjacent coral reef systems arevulnerable to temperature increases (see subsection 3.7).<strong>Change</strong>s in rainfall patterns <strong>and</strong> downscaled rainfallprojections may show rainfall trends, as well asdemonstrate changes in seasonality of rainfall (whichmight affect phenology). <strong>Change</strong>s in frequency of dryspells can affect mangroves separately from the longertermtrends.More severe or more frequent freshwater floodingevents are excluded from the vulnerability assessmenteven though they cause mortality as mentionedearlier. This is because site-specific storm impacts areimpossible to predict, <strong>and</strong> overall sea level inundationvulnerability is covered in subsection 3.5.Drier conditions may increase the vulnerabilityof mangroves, such as through reduced diversity,photosynthesis <strong>and</strong> productivity, as well as groundlevelsubsidence (Table 1). However, as demonstratedin the case study below, rainfall projections currentlytend to be highly uncertain <strong>and</strong> hence difficult toquantify. This will improve as rainfall modelingbecomes more sophisticated.Rank vulnerability on the scale below. Record the scorein the final column (S = score).Strengths/weaknessesData on changes in ground level <strong>and</strong> forest diversity<strong>and</strong> condition are collected in the forest assessment,elevation <strong>and</strong> sedimentation components of thevulnerability assessment already described. From thesebaseline surveys, such changes can be monitored in thefuture <strong>and</strong> the results interpreted relative to rainfallchanges. Rainfall projections within downscaledclimate modeling may eventually improve in their levelof certainty, which would make them more useful formangrove vulnerability assessment.Rank 1 2 3 4 5 SExposure factorsPrecipitation change Becomes wetter Rainfall unchanged Somewhat drier Moderately drier Significantly drierCase studyFollowing traditional approaches in climate changevulnerability assessment, the WWF project initiallyinvestigated climate models for the pilot sites <strong>and</strong>found very uncertain results for the exposure factor ofprecipitation change (Table 22), in that it was predictedto either get wetter or drier.In Fiji, downscaled modeling was undertaken to try toreduce this uncertainty. The results were inconclusive,with 7 of 12 models showing a future (2080–99) withhigher annual rainfall than at present (1980–99).These results implied that it would be wise forenvironmental planners, when reviewing adaptationoptions, to consider both negative <strong>and</strong> positiverainfall projections for the 21st century. Hence, themodeling was of little help to the overall vulnerabilityassessment.Regions 2010-2039 2040-2069 2070-2099Mediterranean -35.6 to +55.1 -52.6 to +38.3 -61.0 to +6.2Caribbean -14.2 to +13.7 -36.3 to +34.2 -49.3 to +28.9Indian Ocean -5.4 to +6.0 -6.9 to +12.4 -9.8 to +14.7NorthernPacificSouthernPacific-6.3 to +9.1 -19.2 to +21.3 -2.7 to +25.8-3.9 to +3.4 -8.23 to +6.7 -14.0 to +14.6Table 22. Projected change in precipitation over smallisl<strong>and</strong>s, by region (percentage). The ranges are derivedfrom seven atmosphere-ocean general circulationmodels (GCMs) run under the key SRES emissionsscenarios (from IPCC, 2007c).<strong>Climate</strong> <strong>Change</strong> <strong>Vulnerability</strong> <strong>Assessment</strong> <strong>and</strong> <strong>Adaptation</strong> <strong>Planning</strong> for Mangrove Systems | 73
- Page 2 and 3:
© 2012 WWFISBN: 978-92-990069-0-0R
- Page 4 and 5:
© naturepl.com/Tim Laman/WWF
- Page 6:
Table of Contents, Figures8.0 Gloss
- Page 12 and 13:
Photo: Monifa Fiu
- Page 16 and 17:
1.0 Mangroves: Values, Status and T
- Page 20:
2.0 Planning a Vulnerability Assess
- Page 26 and 27:
3.0 Conducting a Vulnerability Asse
- Page 32:
3.0 Conducting a Vulnerability Asse
- Page 36 and 37: 3.0 Conducting a Vulnerability Asse
- Page 40 and 41: 3.0 Conducting a Vulnerability Asse
- Page 42: 3.0 Conducting a Vulnerability Asse
- Page 46 and 47: 3.0 Conducting a Vulnerability Asse
- Page 49: 3.0 Conducting a Vulnerability Asse
- Page 56 and 57: 3.0 Conducting a Vulnerability Asse
- Page 59: 3.0 Conducting a Vulnerability Asse
- Page 64: 3.0 Conducting a Vulnerability Asse
- Page 67 and 68: 3.0 Conducting a Vulnerability Asse
- Page 71: 3.0 Conducting a Vulnerability Asse
- Page 75 and 76: 3.0 Conducting a Vulnerability Asse
- Page 77: 3.0 Conducting a Vulnerability Asse
- Page 80 and 81: 3.0 Conducting a Vulnerability Asse
- Page 82 and 83: 3.0 Conducting a Vulnerability Asse
- Page 86 and 87: 3.0 Conducting a Vulnerability Asse
- Page 88 and 89: 3.0 Conducting a Vulnerability Asse
- Page 90 and 91: 3.0 Conducting a Vulnerability Asse
- Page 92 and 93: 4.0 Interpreting a Mangrove Vuneral
- Page 94 and 95: 4.0 Interpreting a Mangrove Vuneral
- Page 96 and 97: 4.0 Interpreting a Mangrove Vuneral
- Page 98: 5.0 Developing Adaptation MeasuresT
- Page 102 and 103: 5.0 Developing Adaptation Measures5
- Page 104 and 105: 5.0 Developing Adaptation Measureso
- Page 106 and 107: 5.0 Developing Adaptation Measures5
- Page 109 and 110: 5.0 Developing Adaptation MeasuresF
- Page 111 and 112: 5.0 Developing Adaptation MeasuresF
- Page 114 and 115: 5.0 Developing Adaptation Measures5
- Page 116 and 117: 6.0 ConclusionsClimate change, part
- Page 118 and 119: 7.0 ReferencesBosire, J. O., Dahdou
- Page 120 and 121: 7.0 ReferencesForbes, A. T., & Cyru
- Page 122 and 123: 7.0 ReferencesKovacs, J. M., Wang,
- Page 124 and 125: 7.0 ReferencesRogers, K., Saintilan
- Page 126 and 127: 8.0 GlossaryAbscission collar A reg
- Page 128 and 129: 8.0 GlossaryLiDAR Light Detection a
- Page 130 and 131: Photo: Rob Anders
- Page 132 and 133: Appendix: Data Sheets120 | Climate
- Page 134 and 135:
Appendix: Data Sheets122 | Climate
- Page 136 and 137:
Appendix: Data SheetsData sheet for
- Page 138 and 139:
Appendix: Data Sheets126 | Climate
- Page 140:
Appendix: Data Sheets128 | Climate