Climate Change Vulnerability Assessment and Adaptation Planning ...
Climate Change Vulnerability Assessment and Adaptation Planning ...
Climate Change Vulnerability Assessment and Adaptation Planning ...
- No tags were found...

You also want an ePaper? Increase the reach of your titles
YUMPU automatically turns print PDFs into web optimized ePapers that Google loves.
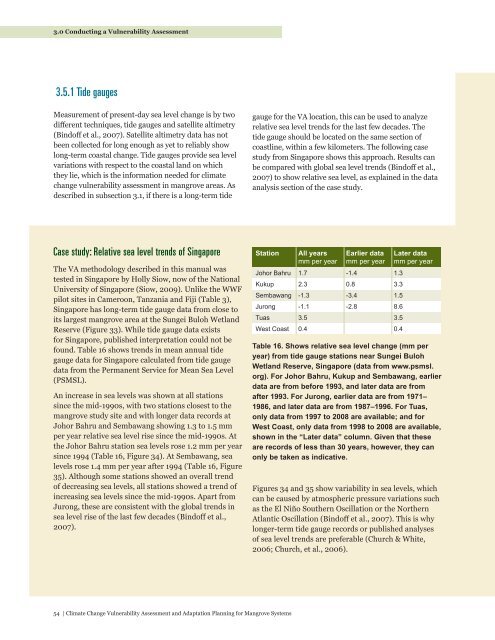
3.0 Conducting a <strong>Vulnerability</strong> <strong>Assessment</strong>3.5.1 Tide gaugesMeasurement of present-day sea level change is by twodifferent techniques, tide gauges <strong>and</strong> satellite altimetry(Bindoff et al., 2007). Satellite altimetry data has notbeen collected for long enough as yet to reliably showlong-term coastal change. Tide gauges provide sea levelvariations with respect to the coastal l<strong>and</strong> on whichthey lie, which is the information needed for climatechange vulnerability assessment in mangrove areas. Asdescribed in subsection 3.1, if there is a long-term tidegauge for the VA location, this can be used to analyzerelative sea level trends for the last few decades. Thetide gauge should be located on the same section ofcoastline, within a few kilometers. The following casestudy from Singapore shows this approach. Results canbe compared with global sea level trends (Bindoff et al.,2007) to show relative sea level, as explained in the dataanalysis section of the case study.Case study: Relative sea level trends of SingaporeThe VA methodology described in this manual wastested in Singapore by Holly Siow, now of the NationalUniversity of Singapore (Siow, 2009). Unlike the WWFpilot sites in Cameroon, Tanzania <strong>and</strong> Fiji (Table 3),Singapore has long-term tide gauge data from close toits largest mangrove area at the Sungei Buloh Wetl<strong>and</strong>Reserve (Figure 33). While tide gauge data existsfor Singapore, published interpretation could not befound. Table 16 shows trends in mean annual tidegauge data for Singapore calculated from tide gaugedata from the Permanent Service for Mean Sea Level(PSMSL).An increase in sea levels was shown at all stationssince the mid-1990s, with two stations closest to themangrove study site <strong>and</strong> with longer data records atJohor Bahru <strong>and</strong> Sembawang showing 1.3 to 1.5 mmper year relative sea level rise since the mid-1990s. Atthe Johor Bahru station sea levels rose 1.2 mm per yearsince 1994 (Table 16, Figure 34). At Sembawang, sealevels rose 1.4 mm per year after 1994 (Table 16, Figure35). Although some stations showed an overall trendof decreasing sea levels, all stations showed a trend ofincreasing sea levels since the mid-1990s. Apart fromJurong, these are consistent with the global trends insea level rise of the last few decades (Bindoff et al.,2007).StationAll yearsmm per yearEarlier datamm per yearJohor Bahru 1.7 -1.4 1.3Kukup 2.3 0.8 3.3Sembawang -1.3 -3.4 1.5Jurong -1.1 -2.8 8.6Tuas 3.5 3.5West Coast 0.4 0.4Later datamm per yearTable 16. Shows relative sea level change (mm peryear) from tide gauge stations near Sungei BulohWetl<strong>and</strong> Reserve, Singapore (data from www.psmsl.org). For Johor Bahru, Kukup <strong>and</strong> Sembawang, earlierdata are from before 1993, <strong>and</strong> later data are fromafter 1993. For Jurong, earlier data are from 1971–1986, <strong>and</strong> later data are from 1987–1996. For Tuas,only data from 1997 to 2008 are available; <strong>and</strong> forWest Coast, only data from 1998 to 2008 are available,shown in the “Later data” column. Given that theseare records of less than 30 years, however, they canonly be taken as indicative.Figures 34 <strong>and</strong> 35 show variability in sea levels, whichcan be caused by atmospheric pressure variations suchas the El Niño Southern Oscillation or the NorthernAtlantic Oscillation (Bindoff et al., 2007). This is whylonger-term tide gauge records or published analysesof sea level trends are preferable (Church & White,2006; Church, et al., 2006).54 | <strong>Climate</strong> <strong>Change</strong> <strong>Vulnerability</strong> <strong>Assessment</strong> <strong>and</strong> <strong>Adaptation</strong> <strong>Planning</strong> for Mangrove Systems