Chemistry 155 Introduction to Instrumental Analytical Chemistry
Chemistry 155 Introduction to Instrumental Analytical Chemistry
Chemistry 155 Introduction to Instrumental Analytical Chemistry

Create successful ePaper yourself
Turn your PDF publications into a flip-book with our unique Google optimized e-Paper software.
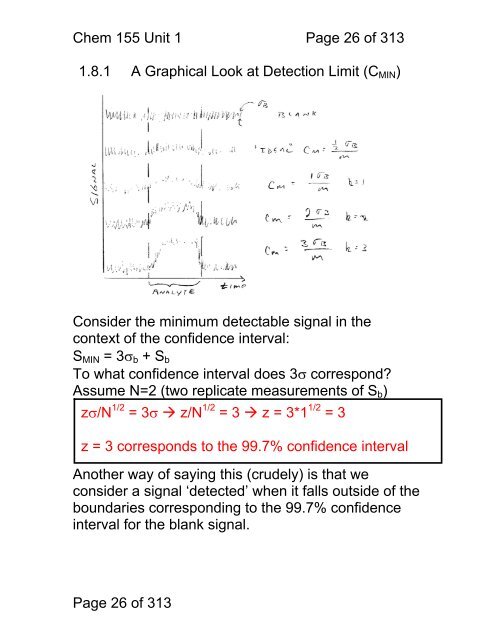
Chem <strong>155</strong> Unit 1 Page 26 of 3131.8.1 A Graphical Look at Detection Limit (C MIN )Consider the minimum detectable signal in thecontext of the confidence interval:S MIN = 3σ b + S bTo what confidence interval does 3σ correspond?Assume N=2 (two replicate measurements of S b )zσ/N 1/2 = 3σ z/N 1/2 = 3 z = 3*1 1/2 = 3z = 3 corresponds <strong>to</strong> the 99.7% confidence intervalAnother way of saying this (crudely) is that weconsider a signal ‘detected’ when it falls outside of theboundaries corresponding <strong>to</strong> the 99.7% confidenceinterval for the blank signal.Page 26 of 313