president & cfo - UB Group
president & cfo - UB Group
president & cfo - UB Group
- No tags were found...

You also want an ePaper? Increase the reach of your titles
YUMPU automatically turns print PDFs into web optimized ePapers that Google loves.
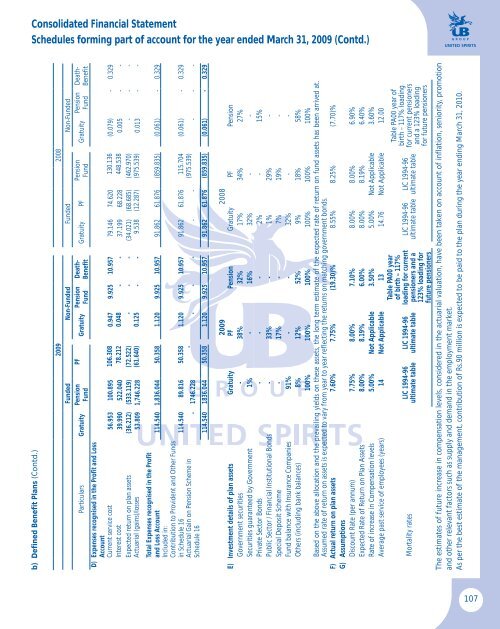
Consolidated Financial StatementSchedules forming part of account for the year ended March 31, 2009 (Contd.)b) Defined Benefit Plans (Contd.)Particulars Gratuity2009 2008Funded Non-Funded Funded Non-FundedPensionFundPFGratuity PensionFundDeath-BenefitGratuity PFD) Expenses recognised in the Profit and LossAccountCurrent service cost 56.953 100.895 106.308 0.947 9.925 10.957 79.146 74.620 130.136 (0.079) - 0.329Interest cost 39.990 522.040 78.212 0.048 - - 37.199 68.228 448.538 0.005 - -Expected return on plan assets (36.212) (533.119) (72.522) - - - (34.021) (68.685) (462.970) - - -Actuarial (gains)/losses 53.809 1,746.228 (61.640) 0.125 - - 9.538 (12.287) (975.539) 0.013 - -Total Expenses recognised in the Profitand Loss Account 114.540 1,836.044 50.358 1.120 9.925 10.957 91.862 61.876 (859.835) (0.061) - 0.329Included in:Contribution to Provident and Other Fundsin Schedule 16 114.540 89.816 50.358 1.120 9.925 10.957 91.862 61.876 115.704 (0.061) - 0.329Actuarial Gain on Pension Scheme inSchedule 16- 1746.228-- - - - -PensionFund(975.539)GratuityPensionFundDeath-Benefit- - -114.540 1836.044 50.358 1.120 9.925 10.957 91.862 61.876 (859.835) (0.061) - 0.3292009 2008E) Investment details of plan assets Gratuity PF Pension Gratuity PF PensionGovernment securities - 38% 32% 17% 34% 27%Securities guaranteed by Government 1% - 16% 32% - -Private Sector Bonds - - - 2% - 15%Public Sector / Financial Institutional Bonds - 33% - 1% 29% -Special Deposit Scheme - 17% - 7% 19% -Fund balance with Insurance Companies 91% - - 32% - -Others (including bank balances) 8% 12% 52% 9% 18% 58%100% 100% 100% 100% 100% 100%Based on the above allocation and the prevailing yields on these assets, the long term estimate of the expected rate of return on fund assets has been arrived at.Assumed rate of return on assets is expected to vary from year to year reflecting the returns on matching government bonds.F) Actual return on plan assets 7.60% 7.75% (19.30)% 8.55% 8.25% (7.70)%G) AssumptionsDiscount Rate (per annum) 7.75% 8.00% 7.10% 8.00% 8.00% 6.90%Expected Rate of Return on Plan Assets 8.00% 8.19% 6.00% 8.00% 8.19% 6.40%Rate of increase in Compensation levels 5.00% Not Applicable 3.50% 5.00% Not Applicable 3.60%Average past service of employees (years) 14 Not Applicable 13 14.76 Not Applicable 12.00Mortality ratesLIC 1994-96ultimate tableLIC 1994-96ultimate tableTable PA00 yearof birth – 117%loading for currentpensioners and a123% loading forfuture pensionersLIC 1994-96ultimate tableLIC 1994-96ultimate tableTable PA00 year ofbirth – 117% loadingfor current pensionersand a 123% loadingfor future pensionersThe estimates of future increase in compensation levels, considered in the actuarial valuation, have been taken on account of inflation, seniority, promotionand other relevant factors such as supply and demand in the employment market.As per the best estimate of the management, contribution of Rs.90 million is expected to be paid to the plan during the year ending March 31, 2010.107