president & cfo - UB Group
president & cfo - UB Group
president & cfo - UB Group
- No tags were found...

Create successful ePaper yourself
Turn your PDF publications into a flip-book with our unique Google optimized e-Paper software.
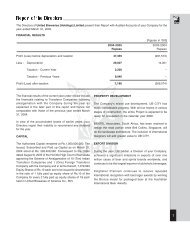
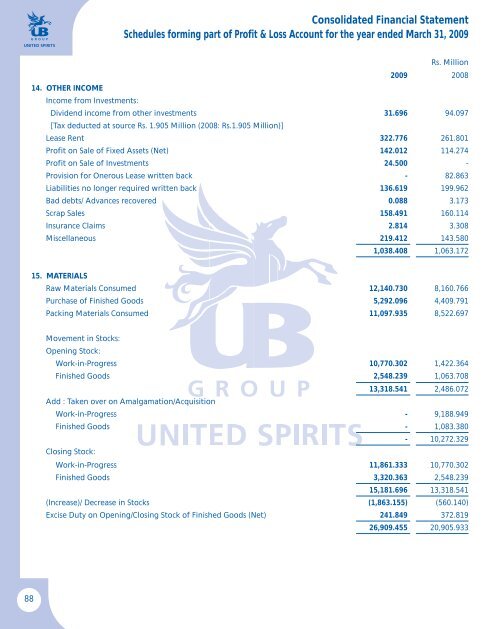
Consolidated Financial StatementSchedules forming part of Profit & Loss Account for the year ended March 31, 2009Rs. Million2009 200814. OthEr INcOmEIncome from Investments:Dividend income from other investments 31.696 94.097[Tax deducted at source Rs. 1.905 Million (2008: Rs.1.905 Million)]Lease Rent 322.776 261.801Profit on Sale of Fixed Assets (Net) 142.012 114.274Profit on Sale of Investments 24.500 -Provision for Onerous Lease written back - 82.863Liabilities no longer required written back 136.619 199.962Bad debts/ Advances recovered 0.088 3.173Scrap Sales 158.491 160.114Insurance Claims 2.814 3.308Miscellaneous 219.412 143.5801,038.408 1,063.17215. MatErialsRaw Materials Consumed 12,140.730 8,160.766Purchase of Finished Goods 5,292.096 4,409.791Packing Materials Consumed 11,097.935 8,522.697Movement in Stocks:Opening Stock:Work-in-Progress 10,770.302 1,422.364Finished Goods 2,548.239 1,063.70813,318.541 2,486.072Add : Taken over on Amalgamation/AcquisitionWork-in-Progress - 9,188.949Finished Goods - 1,083.380- 10,272.329Closing Stock:Work-in-Progress 11,861.333 10,770.302Finished Goods 3,320.363 2,548.23915,181.696 13,318.541(Increase)/ Decrease in Stocks (1,863.155) (560.140)Excise Duty on Opening/Closing Stock of Finished Goods (Net) 241.849 372.81926,909.455 20,905.93388