Consolidated Financial StatementSchedules forming part of account for the year ended March 31, 2009 (Contd.)6. Fixed Assetsa) Estimated amount of contracts remaining to be executed on capital account and not provided for (net ofadvances) – Rs. 472.728 Million (2008: Rs. 553.079 Million).b) In view of different sets of environment in which foreign subsidiaries operate in their respective countries,provision for depreciation is made to comply with local laws and use of management estimate. It is practicallynot possible to align rates of depreciation of such subsidiaries with those of the Company. However onreview, the management is of the opinion that provision of such depreciation is adequate.Accounting policies followed by Whyte and Mackay <strong>Group</strong> in respect of depreciation on fixed assets aredifferent from accounting policies of the Company as mentioned in Note 8(iii) Schedule 18. The proportionof the fixed assets in the consolidated financial statement to which different accounting policies have beenapplied are as below:Rs. Million2009 2008Gross Block Proportion%Gross Block Proportion%Building 2,195.330 49% 2,325.689 54%Plant & Machinery 5,193.470 61% 5,361.108 62%Vehicles 28.880 16% 31.723 13%7. Current Assets, Loans and Advancesa) Loans and Advances include:(i)An amount of Rs. 736.429 Million (2008: Rs. 489.847 Million) due from a Tie-up unit secured by the assetsof the Tie-up unit.(ii) An amount of Rs. 250 Million (2008: Rs. Nil) due from a proposed tie-up unit secured by the shares of theproposed tie-up unit.b) Certain confirmation of balances from Sundry Debtors, Loans and Advances, Deposits and Sundry Creditorsare awaited and the account reconciliations of some parties where confirmations have been received are inprogress. Adjustment for differences, if any, arising out of such confirmations/reconciliations would be madein the accounts on receipt of such confirmations and reconciliation thereof. The management is of the opinionthat the impact of adjustments, if any, is not likely to be significant. In the opinion of the management, allCurrent Assets, Loans and Advances including advances on capital accounts would be realised at the values atwhich these are stated in the accounts, in the ordinary course of business.c) Bank balances with scheduled bank includes Rs 154.000 Million (2008: Rs. 715.055 Million) out of the proceedsof the beer business sold in the earlier year, kept under escrow pending resolution of various taxation matters.Subsequent to the year end, the taxation matters have been resolved and the escrow amount has beenreleased.d) The Company has granted interest free loans in foreign currency amounting to Rs.7,435.245 Million [2008: Rs.6190.725 Million, excluding Rs.6836.073 Million relating to Zelinka cancelled on amalgamation as referredto in Note 2(B)(II)(d) above] given to USL Holdings Limited (USL Holdings), BVI, a subsidiary of the Company,for acquisition of long term strategic investments. Management is of the view that out of these loans,Rs.3,630.300 Million (2008: Rs.3,987.000 Million), from the inception of the grant of loans, in substance, formpart of the Company’s net investment in the subsidiary, as the settlement of these loans is neither planned norlikely to occur in the foreseeable future and management intends to convert these loans into investment inshare capital of the subsidiary in near future. Accordingly, in accordance with AS 11 - The Effects of Changesin Foreign Exchange Rates (AS 11), exchange difference aggregating to Rs.463.905 Million (2008: Rs. 106.905Million excluding Rs.715.043 Million relating to loans to Zelinka referred in Note 2(B)(II)(d) above) arising onsuch loans has been accumulated in a foreign currency translation reserve, which at the time of the disposalof the net investment in these subsidiaries would be recognised as income or as expenses.108
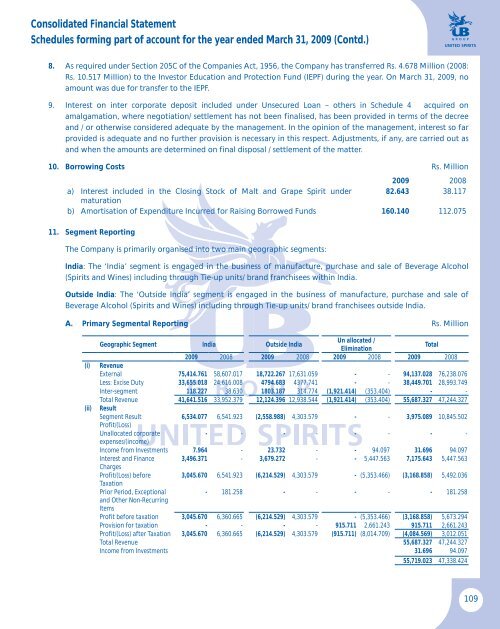
Consolidated Financial StatementSchedules forming part of account for the year ended March 31, 2009 (Contd.)8. As required under Section 205C of the Companies Act, 1956, the Company has transferred Rs. 4.678 Million (2008:Rs. 10.517 Million) to the Investor Education and Protection Fund (IEPF) during the year. On March 31, 2009, noamount was due for transfer to the IEPF.9. Interest on inter corporate deposit included under Unsecured Loan – others in Schedule 4 acquired onamalgamation, where negotiation/ settlement has not been finalised, has been provided in terms of the decreeand / or otherwise considered adequate by the management. In the opinion of the management, interest so farprovided is adequate and no further provision is necessary in this respect. Adjustments, if any, are carried out asand when the amounts are determined on final disposal / settlement of the matter.10. Borrowing Costs Rs. Million2009 2008a) Interest included in the Closing Stock of Malt and Grape Spirit under 82.643 38.117maturationb) Amortisation of Expenditure Incurred for Raising Borrowed Funds 160.140 112.07511. Segment ReportingThe Company is primarily organised into two main geographic segments:India: The ‘India’ segment is engaged in the business of manufacture, purchase and sale of Beverage Alcohol(Spirits and Wines) including through Tie-up units/ brand franchisees within India.Outside India: The ‘Outside India’ segment is engaged in the business of manufacture, purchase and sale ofBeverage Alcohol (Spirits and Wines) including through Tie-up units/ brand franchisees outside India.A. Primary Segmental Reporting Rs. Million(i)(ii)Geographic Segment India Outside IndiaUn allocated /EliminationTotal2009 2008 2009 2008 2009 2008 2009 2008RevenueExternal 75,414.761 58,607.017 18,722.267 17,631.059 - - 94,137.028 76,238.076Less: Excise Duty 33,655.018 24,616.008 4794.683 4377.741 - - 38,449.701 28,993.749Inter-segment 118.227 38.630 1803.187 314.774 (1,921.414) (353.404) - -Total Revenue 41,641.516 33,952.379 12,124.396 12,938.544 (1,921.414) (353.404) 55,687.327 47,244.327ResultSegment Result6,534.077 6,541.923 (2,558.988) 4,303.579 - - 3,975.089 10,845.502Profit/(Loss)Unallocated corporate- - - - - - - -expenses/(income)Income from Investments 7.964 - 23.732 - - 94.097 31.696 94.097Interest and Finance 3,496.371 - 3,679.272 - - 5,447.563 7,175.643 5,447.563ChargesProfit/(Loss) before3,045.670 6,541.923 (6,214.529) 4,303.579 - (5,353.466) (3,168.858) 5,492.036TaxationPrior Period, Exceptional- 181.258 - - - - - 181.258and Other Non-RecurringItemsProfit before taxation 3,045.670 6,360.665 (6,214.529) 4,303.579 - (5,353.466) (3,168.858) 5,673.294Provision for taxation - - - - 915.711 2,661.243 915.711 2,661.243Profit/(Loss) after Taxation 3,045.670 6,360.665 (6,214.529) 4,303.579 (915.711) (8,014.709) (4,084.569) 3,012.051Total Revenue 55,687.327 47,244.327Income from Investments 31.696 94.09755,719.023 47,338.424109


