president & cfo - UB Group
president & cfo - UB Group
president & cfo - UB Group
- No tags were found...

Create successful ePaper yourself
Turn your PDF publications into a flip-book with our unique Google optimized e-Paper software.
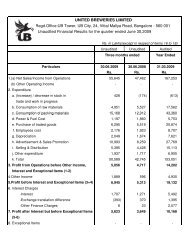
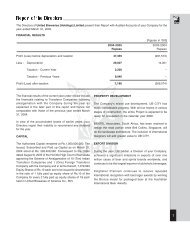
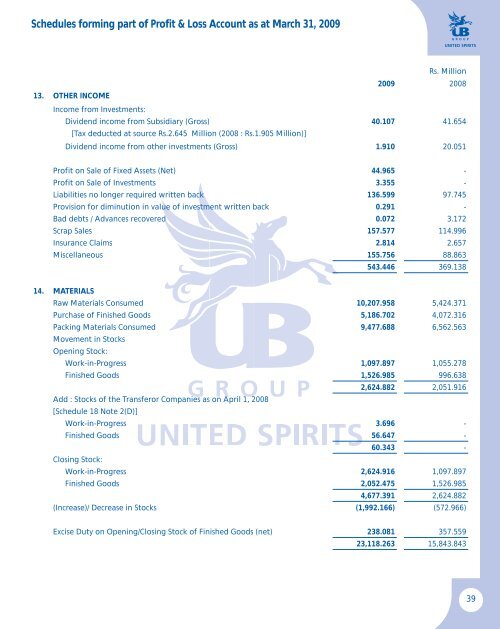
Schedules forming part of Profit & Loss Account as at March 31, 2009Rs. Million2009 200813. Other IncOmeIncome from Investments:Dividend income from Subsidiary (Gross) 40.107 41.654[Tax deducted at source Rs.2.645 Million (2008 : Rs.1.905 Million)]Dividend income from other investments (Gross) 1.910 20.051Profit on Sale of Fixed Assets (Net) 44.965 -Profit on Sale of Investments 3.355 -Liabilities no longer required written back 136.599 97.745Provision for diminution in value of investment written back 0.291 -Bad debts / Advances recovered 0.072 3.172Scrap Sales 157.577 114.996Insurance Claims 2.814 2.657Miscellaneous 155.756 88.863543.446 369.13814. MaterialsRaw Materials Consumed 10,207.958 5,424.371Purchase of Finished Goods 5,186.702 4,072.316Packing Materials Consumed 9,477.688 6,562.563Movement in StocksOpening Stock:Work-in-Progress 1,097.897 1,055.278Finished Goods 1,526.985 996.6382,624.882 2,051.916Add : Stocks of the Transferor Companies as on April 1, 2008[Schedule 18 Note 2(D)]Work-in-Progress 3.696 -Finished Goods 56.647 -60.343 -Closing Stock:Work-in-Progress 2,624.916 1,097.897Finished Goods 2,052.475 1,526.9854,677.391 2,624.882(Increase)/ Decrease in Stocks (1,992.166) (572.966)Excise Duty on Opening/Closing Stock of Finished Goods (net) 238.081 357.55923,118.263 15,843.84339