Minnegang Creek Flood Study Report - Wollongong City Council
Minnegang Creek Flood Study Report - Wollongong City Council
Minnegang Creek Flood Study Report - Wollongong City Council
- No tags were found...

You also want an ePaper? Increase the reach of your titles
YUMPU automatically turns print PDFs into web optimized ePapers that Google loves.
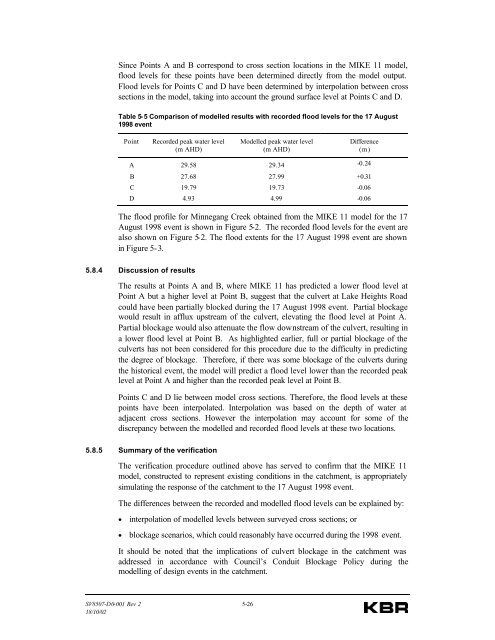
Since Points A and B correspond to cross section locations in the MIKE 11 model,flood levels for these points have been determined directly from the model output.<strong>Flood</strong> levels for Points C and D have been determined by interpolation between crosssections in the model, taking into account the ground surface level at Points C and D.Table 5-5 Comparison of modelled results with recorded flood levels for the 17 August1998 eventPointRecorded peak water level(m AHD)Modelled peak water level(m AHD)Difference(m)A 29.58 29.34 -0.24B 27.68 27.99 +0.31C 19.79 19.73 -0.06D 4.93 4.99 -0.06The flood profile for <strong>Minnegang</strong> <strong>Creek</strong> obtained from the MIKE 11 model for the 17August 1998 event is shown in Figure 5-2. The recorded flood levels for the event arealso shown on Figure 5-2. The flood extents for the 17 August 1998 event are shownin Figure 5-3.5.8.4 Discussion of resultsThe results at Points A and B, where MIKE 11 has predicted a lower flood level atPoint A but a higher level at Point B, suggest that the culvert at Lake Heights Roadcould have been partially blocked during the 17 August 1998 event. Partial blockagewould result in afflux upstream of the culvert, elevating the flood level at Point A.Partial blockage would also attenuate the flow downstream of the culvert, resulting ina lower flood level at Point B. As highlighted earlier, full or partial blockage of theculverts has not been considered for this procedure due to the difficulty in predictingthe degree of blockage. Therefore, if there was some blockage of the culverts duringthe historical event, the model will predict a flood level lower than the recorded peaklevel at Point A and higher than the recorded peak level at Point B.Points C and D lie between model cross sections. Therefore, the flood levels at thesepoints have been interpolated. Interpolation was based on the depth of water atadjacent cross sections. However the interpolation may account for some of thediscrepancy between the modelled and recorded flood levels at these two locations.5.8.5 Summary of the verificationThe verification procedure outlined above has served to confirm that the MIKE 11model, constructed to represent existing conditions in the catchment, is appropriatelysimulating the response of the catchment to the 17 August 1998 event.The differences between the recorded and modelled flood levels can be explained by:• interpolation of modelled levels between surveyed cross sections; or• blockage scenarios, which could reasonably have occurred during the 1998 event.It should be noted that the implications of culvert blockage in the catchment wasaddressed in accordance with <strong>Council</strong>’s Conduit Blockage Policy during themodelling of design events in the catchment.SV8507-D0-001 Rev 2 5-2618/10/02