Minnegang Creek Flood Study Report - Wollongong City Council
Minnegang Creek Flood Study Report - Wollongong City Council
Minnegang Creek Flood Study Report - Wollongong City Council
- No tags were found...

You also want an ePaper? Increase the reach of your titles
YUMPU automatically turns print PDFs into web optimized ePapers that Google loves.
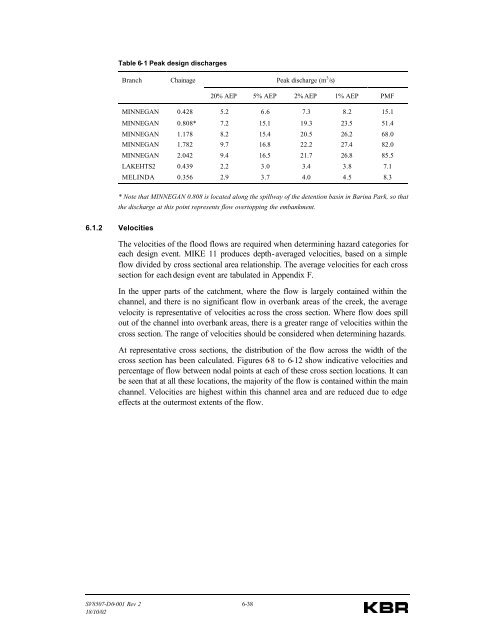
Table 6-1 Peak design dischargesBranchChainagePeak discharge (m 3 /s)20% AEP 5% AEP 2% AEP 1% AEP PMFMINNEGAN 0.428 5.2 6.6 7.3 8.2 15.1MINNEGAN 0.808* 7.2 15.1 19.3 23.5 51.4MINNEGAN 1.178 8.2 15.4 20.5 26.2 68.0MINNEGAN 1.782 9.7 16.8 22.2 27.4 82.0MINNEGAN 2.042 9.4 16.5 21.7 26.8 85.5LAKEHTS2 0.439 2.2 3.0 3.4 3.8 7.1MELINDA 0.356 2.9 3.7 4.0 4.5 8.3* Note that MINNEGAN 0.808 is located along the spillway of the detention basin in Barina Park, so thatthe discharge at this point represents flow overtopping the embankment.6.1.2 VelocitiesThe velocities of the flood flows are required when determining hazard categories foreach design event. MIKE 11 produces depth-averaged velocities, based on a simpleflow divided by cross sectional area relationship. The average velocities for each crosssection for each design event are tabulated in Appendix F.In the upper parts of the catchment, where the flow is largely contained within thechannel, and there is no significant flow in overbank areas of the creek, the averagevelocity is representative of velocities ac ross the cross section. Where flow does spillout of the channel into overbank areas, there is a greater range of velocities within thecross section. The range of velocities should be considered when determining hazards.At representative cross sections, the distribution of the flow across the width of thecross section has been calculated. Figures 6-8 to 6-12 show indicative velocities andpercentage of flow between nodal points at each of these cross section locations. It canbe seen that at all these locations, the majority of the flow is contained within the mainchannel. Velocities are highest within this channel area and are reduced due to edgeeffects at the outermost extents of the flow.SV8507-D0-001 Rev 2 6-3818/10/02