Financial Statements - Entel
Financial Statements - Entel
Financial Statements - Entel
- No tags were found...

You also want an ePaper? Increase the reach of your titles
YUMPU automatically turns print PDFs into web optimized ePapers that Google loves.
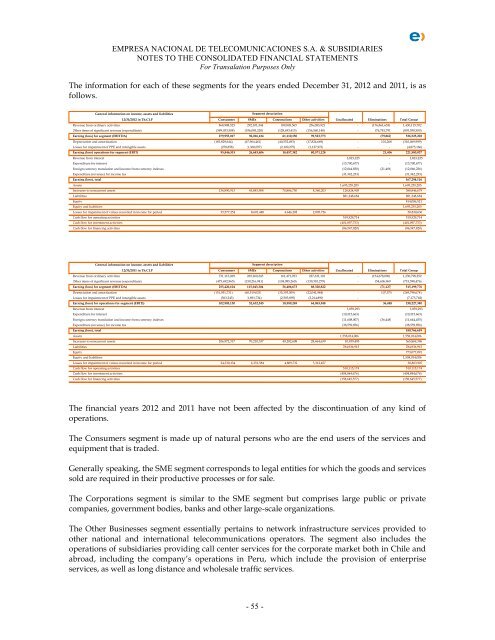
EMPRESA NACIONAL DE TELECOMUNICACIONES S.A. & SUBSIDIARIESNOTES TO THE CONSOLIDATED FINANCIAL STATEMENTSFor Transalation Purposes OnlyThe information for each of these segments for the years ended December 31, 2012 and 2011, is asfollows.General information on income, assets and liabilitiesSegment description12/31/2012 in Th.CLPConsumers SMEs Corporations Other activities Unallocated Eliminations Total GroupRevenue from ordinary activities 868,988,525 292,101,344 189,803,565 256,083,921 - (176,861,653) 1,430,115,702Other items of significant revenue (expenditure) (589,033,508) (196,085,220) (128,693,415) (156,560,148) - 176,781,791 (893,590,500)Earning (loss) for segment (EBITDA) 279,955,017 96,016,124 61,110,150 99,523,773 (79,862) 536,525,202Depreciation and amortization (183,829,644) (67,964,461) (40,552,493) (17,824,669) - 101,268 (310,069,999)Losses for impairment of PPE and intangible assets (278,858) (1,368,057) (2,100,275) (1,127,976) - - (4,875,166)Earning (loss) operations for segment (EBIT) 95,846,515 26,683,606 18,457,382 80,571,128 21,406 221,580,037Revenue from interest 2,823,225 - 2,823,225Expenditure for interest (13,700,677) - (13,700,677)Foreign currency translation and income from currency indexes (12,044,830) (21,406) (12,066,236)Expenditure (revenue) for income tax (31,342,233) - (31,342,233)Earning (loss), total 167,294,116Assets 1,695,255,205 1,695,255,205Increases to noncurrent assets 134,890,913 45,883,908 70,886,750 8,360,203 128,824,905 388,846,679Liabilities 881,248,684 881,248,684Equity 814,006,521Equity and liabilities 1,695,255,205Losses for impairment of values recorded in income for period 35,577,254 8,601,448 4,646,208 2,005,726 - 50,830,636Cash flow for operating activities 519,529,714 519,529,714Cash flow for investment activities (401,097,753) (401,097,753)Cash flow for financing activities (86,547,820) (86,547,820)General information on income, assets and liabilitiesSegment description12/31/2011 in Th.CLPConsumers SMEs Corporations Other activities Unallocated Eliminations Total GroupRevenue from ordinary activities 731,113,069 265,260,245 161,471,933 227,631,101 - (154,678,096) 1,230,798,252Other items of significant revenue (expenditure) (475,692,965) (150,216,941) (104,985,260) (139,310,279) - 154,606,969 (715,598,476)Earning (loss) for segment (EBITDA) 255,420,104 115,043,304 56,486,673 88,320,822 (71,127) 515,199,776Depreciation and amortization (151,951,731) (60,519,025) (35,393,509) (22,041,984) - 107,575 (269,798,674)Losses for impairment of PPE and intangible assets (563,243) (1,891,734) (2,503,895) (2,214,890) - (7,173,762)Earning (loss) for operations for segment (EBIT)) 102,905,130 52,632,545 18,589,269 64,063,948 36,448 238,227,340Revenue from interest 3,059,293 3,059,293Expenditure for interest (10,315,663) (10,315,663)Foreign currency translation and income from currency indexes (11,608,007) (36,448) (11,644,455)Expenditure (revenue) for income tax (38,559,856) (38,559,856)Earning (loss), total 180,766,659Assets 1,558,014,006 1,558,014,006Increases to noncurrent assets 206,972,317 70,210,337 49,282,608 28,464,639 10,939,495 365,869,396Liabilities 784,936,915 784,936,915Equity 773,077,091Equity and liabilities 1,558,014,006Losses for impairment of values recorded in income for period 24,330,134 6,351,584 4,809,732 3,312,457 - 38,803,907Cash flow for operating activities 510,115,174 510,115,174Cash flow for investment activities (404,844,676) (404,844,676)Cash flow for financing activities (158,645,577) (158,645,577)The financial years 2012 and 2011 have not been affected by the discontinuation of any kind ofoperations.The Consumers segment is made up of natural persons who are the end users of the services andequipment that is traded.Generally speaking, the SME segment corresponds to legal entities for which the goods and servicessold are required in their productive processes or for sale.The Corporations segment is similar to the SME segment but comprises large public or privatecompanies, government bodies, banks and other large-scale organizations.The Other Businesses segment essentially pertains to network infrastructure services provided toother national and international telecommunications operators. The segment also includes theoperations of subsidiaries providing call center services for the corporate market both in Chile andabroad, including the company’s operations in Peru, which include the provision of enterpriseservices, as well as long distance and wholesale traffic services.- 55 -