2011-2012 Annual Report - Sto:lo Nation
2011-2012 Annual Report - Sto:lo Nation
2011-2012 Annual Report - Sto:lo Nation
Create successful ePaper yourself
Turn your PDF publications into a flip-book with our unique Google optimized e-Paper software.
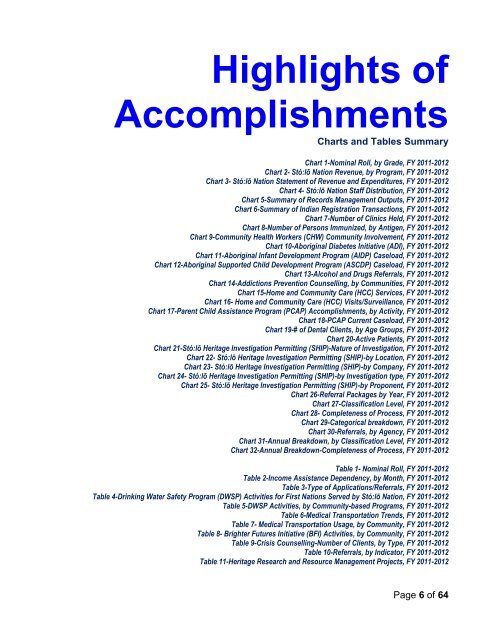
Highlights ofAccomplishmentsCharts and Tables SummaryChart 1-Nominal Roll, by Grade, FY <strong>2011</strong>-<strong>2012</strong>Chart 2- Stó:lō <strong>Nation</strong> Revenue, by Program, FY <strong>2011</strong>-<strong>2012</strong>Chart 3- Stó:lō <strong>Nation</strong> Statement of Revenue and Expenditures, FY <strong>2011</strong>-<strong>2012</strong>Chart 4- Stó:lō <strong>Nation</strong> Staff Distribution, FY <strong>2011</strong>-<strong>2012</strong>Chart 5-Summary of Records Management Outputs, FY <strong>2011</strong>-<strong>2012</strong>Chart 6-Summary of Indian Registration Transactions, FY <strong>2011</strong>-<strong>2012</strong>Chart 7-Number of Clinics Held, FY <strong>2011</strong>-<strong>2012</strong>Chart 8-Number of Persons Immunized, by Antigen, FY <strong>2011</strong>-<strong>2012</strong>Chart 9-Community Health Workers (CHW) Community Involvement, FY <strong>2011</strong>-<strong>2012</strong>Chart 10-Aboriginal Diabetes Initiative (ADI), FY <strong>2011</strong>-<strong>2012</strong>Chart 11-Aboriginal Infant Deve<strong>lo</strong>pment Program (AIDP) Case<strong>lo</strong>ad, FY <strong>2011</strong>-<strong>2012</strong>Chart 12-Aboriginal Supported Child Deve<strong>lo</strong>pment Program (ASCDP) Case<strong>lo</strong>ad, FY <strong>2011</strong>-<strong>2012</strong>Chart 13-Alcohol and Drugs Referrals, FY <strong>2011</strong>-<strong>2012</strong>Chart 14-Addictions Prevention Counselling, by Communities, FY <strong>2011</strong>-<strong>2012</strong>Chart 15-Home and Community Care (HCC) Services, FY <strong>2011</strong>-<strong>2012</strong>Chart 16- Home and Community Care (HCC) Visits/Surveillance, FY <strong>2011</strong>-<strong>2012</strong>Chart 17-Parent Child Assistance Program (PCAP) Accomplishments, by Activity, FY <strong>2011</strong>-<strong>2012</strong>Chart 18-PCAP Current Case<strong>lo</strong>ad, FY <strong>2011</strong>-<strong>2012</strong>Chart 19-# of Dental Clients, by Age Groups, FY <strong>2011</strong>-<strong>2012</strong>Chart 20-Active Patients, FY <strong>2011</strong>-<strong>2012</strong>Chart 21-Stó:lō Heritage Investigation Permitting (SHIP)-Nature of Investigation, FY <strong>2011</strong>-<strong>2012</strong>Chart 22- Stó:lō Heritage Investigation Permitting (SHIP)-by Location, FY <strong>2011</strong>-<strong>2012</strong>Chart 23- Stó:lō Heritage Investigation Permitting (SHIP)-by Company, FY <strong>2011</strong>-<strong>2012</strong>Chart 24- Stó:lō Heritage Investigation Permitting (SHIP)-by Investigation type, FY <strong>2011</strong>-<strong>2012</strong>Chart 25- Stó:lō Heritage Investigation Permitting (SHIP)-by Proponent, FY <strong>2011</strong>-<strong>2012</strong>Chart 26-Referral Packages by Year, FY <strong>2011</strong>-<strong>2012</strong>Chart 27-Classification Level, FY <strong>2011</strong>-<strong>2012</strong>Chart 28- Completeness of Process, FY <strong>2011</strong>-<strong>2012</strong>Chart 29-Categorical breakdown, FY <strong>2011</strong>-<strong>2012</strong>Chart 30-Referrals, by Agency, FY <strong>2011</strong>-<strong>2012</strong>Chart 31-<strong>Annual</strong> Breakdown, by Classification Level, FY <strong>2011</strong>-<strong>2012</strong>Chart 32-<strong>Annual</strong> Breakdown-Completeness of Process, FY <strong>2011</strong>-<strong>2012</strong>Table 1- Nominal Roll, FY <strong>2011</strong>-<strong>2012</strong>Table 2-Income Assistance Dependency, by Month, FY <strong>2011</strong>-<strong>2012</strong>Table 3-Type of Applications/Referrals, FY <strong>2011</strong>-<strong>2012</strong>Table 4-Drinking Water Safety Program (DWSP) Activities for First <strong>Nation</strong>s Served by Stó:lō <strong>Nation</strong>, FY <strong>2011</strong>-<strong>2012</strong>Table 5-DWSP Activities, by Community-based Programs, FY <strong>2011</strong>-<strong>2012</strong>Table 6-Medical Transportation Trends, FY <strong>2011</strong>-<strong>2012</strong>Table 7- Medical Transportation Usage, by Community, FY <strong>2011</strong>-<strong>2012</strong>Table 8- Brighter Futures Initiative (BFI) Activities, by Community, FY <strong>2011</strong>-<strong>2012</strong>Table 9-Crisis Counselling-Number of Clients, by Type, FY <strong>2011</strong>-<strong>2012</strong>Table 10-Referrals, by Indicator, FY <strong>2011</strong>-<strong>2012</strong>Table 11-Heritage Research and Resource Management Projects, FY <strong>2011</strong>-<strong>2012</strong>Page 6 of 64


