Carbon Dioxide and Earth's Future Pursuing the ... - Magazooms
Carbon Dioxide and Earth's Future Pursuing the ... - Magazooms
Carbon Dioxide and Earth's Future Pursuing the ... - Magazooms

You also want an ePaper? Increase the reach of your titles
YUMPU automatically turns print PDFs into web optimized ePapers that Google loves.
www.co2science.org<br />
P a g e | 33<br />
As a result of <strong>the</strong>se findings, <strong>the</strong> two researchers concluded that “if <strong>the</strong>re is an increase in<br />
hurricane activity connected to a greenhouse gas induced global warming, it is currently<br />
obscured by <strong>the</strong> 60-year quasi-periodic cycle.” Consequently, <strong>and</strong> in spite of <strong>the</strong> fact that (1)<br />
<strong>the</strong> hurricane record <strong>the</strong>y analyzed started during <strong>the</strong> final stages of <strong>the</strong> Little Ice Age (which<br />
was <strong>the</strong> coldest period of <strong>the</strong> current interglacial), <strong>and</strong> that (2) <strong>the</strong> planet experienced a<br />
subsequent warming that has been declared by climate alarmists to have been unprecedented<br />
over <strong>the</strong> past millennium or more, <strong>the</strong>y could still find no convincing real-world evidence that<br />
global warming enhances ei<strong>the</strong>r <strong>the</strong> frequency or intensity of hurricanes occurring over <strong>the</strong><br />
Atlantic Ocean.<br />
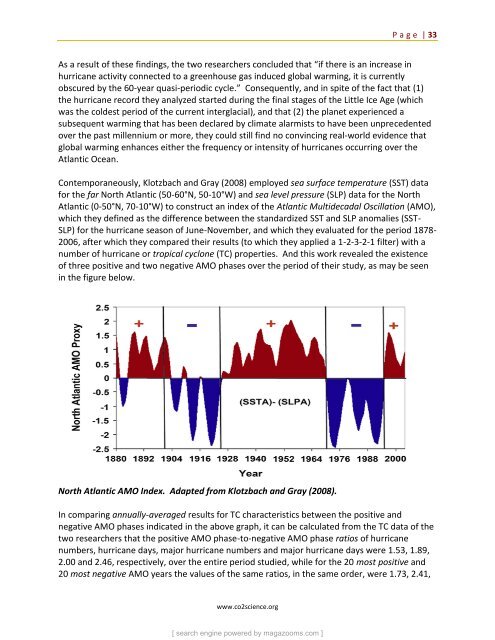
Contemporaneously, Klotzbach <strong>and</strong> Gray (2008) employed sea surface temperature (SST) data<br />
for <strong>the</strong> far North Atlantic (50-60°N, 50-10°W) <strong>and</strong> sea level pressure (SLP) data for <strong>the</strong> North<br />
Atlantic (0-50°N, 70-10°W) to construct an index of <strong>the</strong> Atlantic Multidecadal Oscillation (AMO),<br />
which <strong>the</strong>y defined as <strong>the</strong> difference between <strong>the</strong> st<strong>and</strong>ardized SST <strong>and</strong> SLP anomalies (SST-<br />
SLP) for <strong>the</strong> hurricane season of June-November, <strong>and</strong> which <strong>the</strong>y evaluated for <strong>the</strong> period 1878-<br />
2006, after which <strong>the</strong>y compared <strong>the</strong>ir results (to which <strong>the</strong>y applied a 1-2-3-2-1 filter) with a<br />
number of hurricane or tropical cyclone (TC) properties. And this work revealed <strong>the</strong> existence<br />
of three positive <strong>and</strong> two negative AMO phases over <strong>the</strong> period of <strong>the</strong>ir study, as may be seen<br />
in <strong>the</strong> figure below.<br />
North Atlantic AMO Index. Adapted from Klotzbach <strong>and</strong> Gray (2008).<br />
In comparing annually-averaged results for TC characteristics between <strong>the</strong> positive <strong>and</strong><br />
negative AMO phases indicated in <strong>the</strong> above graph, it can be calculated from <strong>the</strong> TC data of <strong>the</strong><br />
two researchers that <strong>the</strong> positive AMO phase-to-negative AMO phase ratios of hurricane<br />
numbers, hurricane days, major hurricane numbers <strong>and</strong> major hurricane days were 1.53, 1.89,<br />
2.00 <strong>and</strong> 2.46, respectively, over <strong>the</strong> entire period studied, while for <strong>the</strong> 20 most positive <strong>and</strong><br />
20 most negative AMO years <strong>the</strong> values of <strong>the</strong> same ratios, in <strong>the</strong> same order, were 1.73, 2.41,<br />
[ search engine powered by magazooms.com ]