Carbon Dioxide and Earth's Future Pursuing the ... - Magazooms
Carbon Dioxide and Earth's Future Pursuing the ... - Magazooms
Carbon Dioxide and Earth's Future Pursuing the ... - Magazooms

You also want an ePaper? Increase the reach of your titles
YUMPU automatically turns print PDFs into web optimized ePapers that Google loves.
www.co2science.org<br />
P a g e | 8<br />
parts of North America during <strong>the</strong> Medieval Warm Period was “comparable to or exceeds that<br />
of <strong>the</strong> past one-to-two decades in some regions.”<br />
So what happens when reconstructed temperature data are employed all <strong>the</strong> way from <strong>the</strong><br />
beginning to <strong>the</strong> end of <strong>the</strong> past millennium or so? In <strong>the</strong> data section of our website<br />
(www.co2science.org), within what we call our Medieval Warm Period Project, we report <strong>the</strong><br />
results of a new <strong>and</strong> properly-prepared millennial temperature reconstruction for a different<br />
part of <strong>the</strong> globe every single week. Some of <strong>the</strong>se studies allow actual numerical values of<br />
reconstructed temperature differentials between <strong>the</strong> peak warmth of <strong>the</strong> Medieval Warm<br />
Period (MWP) <strong>and</strong> <strong>the</strong> peak warmth of <strong>the</strong> Current Warm Period (CWP) to be determined,<br />
while o<strong>the</strong>rs merely enable one to determine which of <strong>the</strong>se periods was <strong>the</strong> warmer of <strong>the</strong><br />
two.<br />
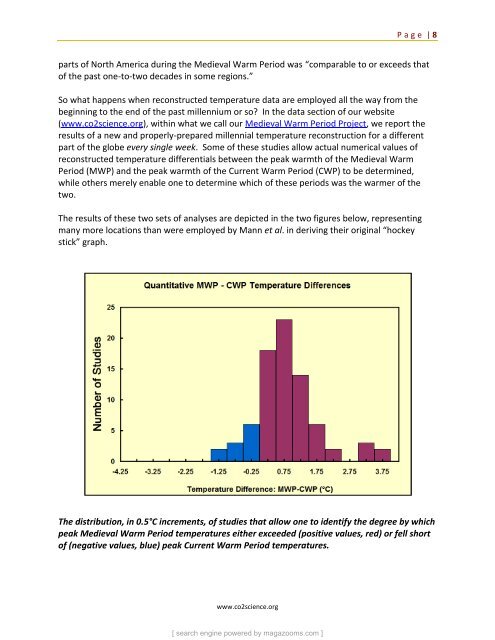
The results of <strong>the</strong>se two sets of analyses are depicted in <strong>the</strong> two figures below, representing<br />
many more locations than were employed by Mann et al. in deriving <strong>the</strong>ir original “hockey<br />
stick” graph.<br />
The distribution, in 0.5°C increments, of studies that allow one to identify <strong>the</strong> degree by which<br />
peak Medieval Warm Period temperatures ei<strong>the</strong>r exceeded (positive values, red) or fell short<br />
of (negative values, blue) peak Current Warm Period temperatures.<br />
[ search engine powered by magazooms.com ]