controlled similarly to the interference in the network. However, in this case RET antennashave shown a limited ability to improve the coverage of the network.b) Load balancing gains: As Figure 39B shows, RET antennas were not as effective <strong>for</strong> loadbalancing as were panning <strong>and</strong> fanning antennas. In this case, modifying tilt was obviouslynot sufficient to move traffic effectively from one sector to another. This resulted in a smallrelative improvement of cell utilization. As a result, the number of overloaded cells was onlyreduced slightly, see Figure 39B.• Improvements with 2D Reconfigurable beam <strong>Antennas</strong>a) Optimization gains: In cases where 2D reconfigurable beam antennas were used, alloptimization objectives were improved when compared to the RET situation. C/I (Ec/Io) <strong>and</strong>cell overlap per<strong>for</strong>mance have been improved, <strong>and</strong> the relative coverage improvement hasmore than doubled compared to the RET case. See Figure 39A.b) Load balancing gains: Since 2D reconfigurable beam antennas have the additional degree offreedom <strong>for</strong> remote changes of the boresight direction (panning), it is shown that the offeredtraffic can be shifted more effectively between the individual cells. This resulted in better loadbalancing, <strong>and</strong> higher cell utilization, hence the ability to reduce the number of overloadedcells significantly, as shown in Figure 39B.• Improvements with 3D Reconfigurable beam <strong>Antennas</strong>a) Optimization gains: In addition to 2D reconfigurable beam antenna cases, the beam width ofthe antenna can be modified remotely (fanning). All of the per<strong>for</strong>mance indicators related tooptimization were significantly improved compared to the 2D reconfigurable beam case. C/I<strong>and</strong> coverage were further improved. In this analysis, compared to RET antennas, C/Iimprovements were almost doubled.b)Load balancing gains: Since 3D reconfigurable beam antennas have the highest flexibility tobalance the load between sectors, i.e., to shift traffic among the cells, the study indicated thatthe increase in the average cell utilization was boosted. This lead to a dramatic reduction inthe number of overloaded cells, as shown in Figure 39B.3.6 ANTENNA BEAM WIDTH DISTRIBUTIONMost existing wireless networks use a fixed choice <strong>for</strong> antenna beam width, that is, the 65° antenna whichis the most widely used antenna pattern worldwide. In contrast, this analysis shows that significant gainscan be achieved with the flexible beam width provided by the 3D reconfigurable beam antenna.To give insight into the most appropriate antenna beam width, Figure 40 shows the statistical distributionof the antenna beam width using the 3D reconfigurable beam antenna from the cases in the previoussections. Two beam width distributions are shown <strong>for</strong> different traffic scenarios. The traffic scenarios aretaken from different network cases in the morning <strong>and</strong> late afternoon, respectively.From the first look, it can be seen that the “65° pattern fits all” maxim is no longer valid. It has alreadybeen shown from the results of the 3D reconfigurable beam antenna in Figure 40 that significantimprovements of coverage, C/I (Ec/Io), as well as a large reduction in the number of overloaded cells,were achieved by the use of a flexible beam width.A narrow antenna beam width results in a higher antenna gain in the main lobe direction, as compared toa wider antenna beam width with a significantly lower main lobe gain. This is one reason why a mixtureof different antenna beam widths provides the best per<strong>for</strong>mance.<strong>4G</strong> <strong>Americas</strong> <strong>MIMO</strong> <strong>and</strong> <strong>Smart</strong> <strong>Antennas</strong> <strong>for</strong> <strong>Mobile</strong> Systems – October 2012 – All Rights Reserved58
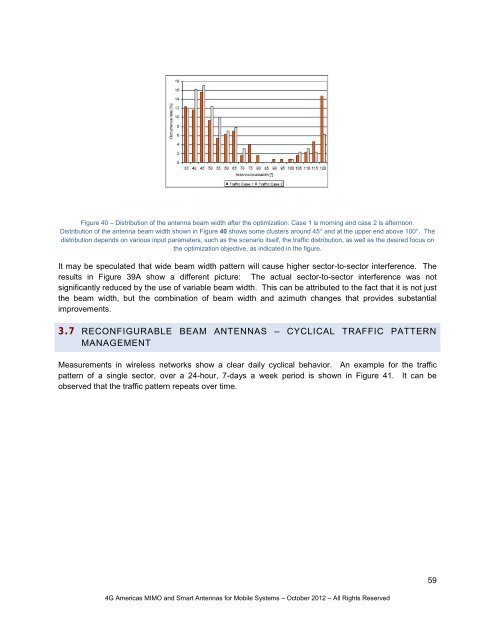
Figure 40 – Distribution of the antenna beam width after the optimization. Case 1 is morning <strong>and</strong> case 2 is afternoon.Distribution of the antenna beam width shown in Figure 40 shows some clusters around 45° <strong>and</strong> at the upper end above 100°. Thedistribution depends on various input parameters, such as the scenario itself, the traffic distribution, as well as the desired focus onthe optimization objective, as indicated in the figure.It may be speculated that wide beam width pattern will cause higher sector-to-sector interference. Theresults in Figure 39A show a different picture: The actual sector-to-sector interference was notsignificantly reduced by the use of variable beam width. This can be attributed to the fact that it is not justthe beam width, but the combination of beam width <strong>and</strong> azimuth changes that provides substantialimprovements.3.7 RECONFIGURABLE BEAM ANTENNAS – CYCLICAL TRAFFIC PATTERNMANAGEMENTMeasurements in wireless networks show a clear daily cyclical behavior. An example <strong>for</strong> the trafficpattern of a single sector, over a 24-hour, 7-days a week period is shown in Figure 41. It can beobserved that the traffic pattern repeats over time.<strong>4G</strong> <strong>Americas</strong> <strong>MIMO</strong> <strong>and</strong> <strong>Smart</strong> <strong>Antennas</strong> <strong>for</strong> <strong>Mobile</strong> Systems – October 2012 – All Rights Reserved59