The Soils of Elgin County - Agriculture and Agri-Food Canada
The Soils of Elgin County - Agriculture and Agri-Food Canada
The Soils of Elgin County - Agriculture and Agri-Food Canada
- No tags were found...
You also want an ePaper? Increase the reach of your titles
YUMPU automatically turns print PDFs into web optimized ePapers that Google loves.
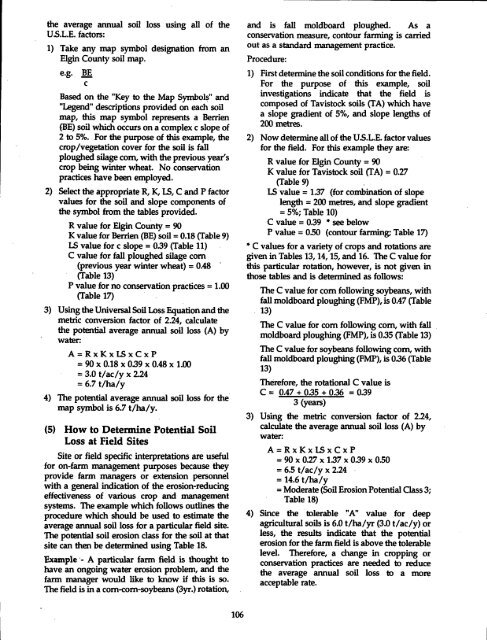
the average annual soil loss using all <strong>of</strong> theUS .L.E . factors:1) Take any map symbol designation from an<strong>Elgin</strong> <strong>County</strong> soil map.e.g.BEcBased on the 'TCey to the Map Symbols" <strong>and</strong>"Legend" descriptions provided on each soilmap, this map symbol represents a Berrien(BE) soil which occurs on a complex c slope <strong>of</strong>2 to 5% . For the purpose <strong>of</strong> this example, thecrop/vegetation cover for the soil is fallploughed silage corn, with the previous year'scrop being winter wheat. No conservationpractices have been employed .2) Select the appropriate R, K, LS, C<strong>and</strong> P factorvalues for the soil <strong>and</strong> slope components <strong>of</strong>the symbol from the tables provided .R value for <strong>Elgin</strong> <strong>County</strong> = 90Kvalue for Berrien (BE) soil = 0.18 (Table 9)LS value for c slope = 0.39 (Table 11)C value for fall ploughed silage corn(previous year winter wheat) = 0.48(Table 13)P value for no conservation practices =1 .00(Table 17)3) Using the Universal Soil Loss Equation<strong>and</strong> themetric conversion factor <strong>of</strong> 2.24, calculatethe potential average annual soil loss (A) bywater:A=RxKxLSxCxP=90 x0.18 x039 x0.48 x1.00= 3.0 t/ac/y x 2.24= 6.7 t/ha/y4) <strong>The</strong> potential average annual soil loss for themap symbol is 6.7 t/ha/y.(5) How to Determine Potential SoilLoss at Field SitesSite or field specific interpretations are usefulfor on-farm management purposes because theyprovide farm managers or extension personnelwith a general indication <strong>of</strong> the erosion-reducingeffectiveness <strong>of</strong> various crop <strong>and</strong> managementsystems . <strong>The</strong> example which follows outlines theprocedure which should be used to estimate theaverage annual soil loss for a particular field site.<strong>The</strong> potential soil erosion class for the soil at thatsite can then be determined using Table 18.'Example ,- A particular farm field is thought tohave an ongoing water erosion problem, <strong>and</strong> thefarm manager would like to know if this is so .<strong>The</strong> field is in a corn-corn-soybeans (3yr.) rotation,<strong>and</strong> is fall moldboard ploughed . As aconservation measure, contour farming is carriedout as a st<strong>and</strong>ard management practice .Procedure :1) First determine the soil conditions for the field.For the purpose <strong>of</strong> this example, soilinvestigations indicate that the field iscomposed <strong>of</strong> Tavistock soils (TA) which havea slope gradient <strong>of</strong> 5%, <strong>and</strong> slope lengths <strong>of</strong>200 metres.2) Now determine all <strong>of</strong> theUS.L.E . factor valuesfor the field . For this example they are.R value for <strong>Elgin</strong> <strong>County</strong> = 90K value for Tavistock soil (TA) = 0.27(Table 9)LS value = 1.37 (for combination <strong>of</strong> slopelength = 200 metres, <strong>and</strong> slope gradient= 5%; Table 10)C value = 0.39 * see belowP value = 050 (contour farming; Table 17)* C values for a variety <strong>of</strong> crops <strong>and</strong> rotations aregiven in Tables 13,14,15, <strong>and</strong> 16 . <strong>The</strong> C value forthis particular rotation, however, is not given inthose tables <strong>and</strong> is determined as follows:<strong>The</strong> C value for corn following soybeans, withfall moldboard ploughing (FMP), is 0.47 (Table13)<strong>The</strong> C value for corn following corn, with fallmoldboard ploughing (FMP), is 0.35 (Table 13)<strong>The</strong> C value for soybeans following corn, withfall moldboard ploughing (FMP), is 0.36 (Table13)<strong>The</strong>refore, the rotational C value isC= 0.47+0.35+0.36 =0.393 (years)3) Using the metric conversion factor <strong>of</strong> 2.24,calculate the average annual soil loss (A) bywater :A=RxKXLSxCxP=90 x0.27 x1.37 x0.39 x0.50= 6.5 t/ac/y x 2.24= 14 .6 t/ha/y= Moderate (Soil Erosion Potential Class 3;Table 18)4) Since the tolerable"A" value for deepagricultural soils is 6.0 t/ha/yr (3.0 t/ac/y) orless, the results indicate that the potentialerosion for the farm field is above the tolerablelevel. <strong>The</strong>refore, a change in cropping orconservation practices are needed to reducethe average annual soil loss to a moreacceptable rate.106


