Table 16.C values for some common crop rotations in <strong>Elgin</strong> <strong>County</strong>Rotation * C value **Silage corn (2; FMP), Soybeans (1 ; F chisel), Winter wheat (1; FMP) 0.40Silage corn (2; FMP), Soybeans (1 ; cultivate), Winter wheat (1 ; FMP) 0.38Silage corn (2; FMP), Spring grain (1 ; FMP), Hay (1) 0 .33Silage corn (2; FMP), Spring grain (1 ; F chisel), Hay (1) . 0 .31Silage corn (2; FMP), Spring grain (1 ; FMP, underseeded with hay), Hay (1) 0.28Silage corn (2; FNP), Hay (3) 0.20Silage corn (3; FMP), Winter wheat (1; FMP) 0.43Grain corn (1 ; FMP), Soybeans (1 ; FMP), Winter wheat (1 ; FMP) 0.33Grain corn (1 ; FMP), soybeans (1 ; FMP) . 0.42Grain corn (2; FMP), Soybeans (1 ; F chisel), Winter wheat (1; FMP) 0 .33Grain corn (2, FMP), Soybeans (1 ; cultivate), Winter wheat (1 : FMP) 0 .31Grain corn (2; FMP), Spring grain (1; FWIP), Hay (1) 0.29Grain corn (2; FMP), Spring grain (1; F chisel), Hay (1) 027Grain corn (2; FMP), Spring grain (1; FMP, underseeded with hay), Hay (1) 024Grain corn (2; FMS), Spring grain (1; FMP), Hay (3) 0.19Grain corn (2; FMP), Spring grain (1 ; F chisel), Hay (3) 0.18Grain corn (2; FMP), Spring grain (1 ; FMP, underseeded with hay), Hay (3) _ 0.16Grain corn (2; FMP), Hay (3) 0.15Grain corn (3; FMP), Winter wheat (1; FMP) 0.33Grain corn (3; F. chisel), Winter wheat (1 ; FMP) 0.28Soybeans (3; FMP), Winter wheat (1 ; FMP) 0.39Soybeans (1; FMP), Winter wheat (1 ; FMP) 0.36Tobacco (SNIP), Rye (grain), Rye (winter cover) 0 .31-2 yr . total C value for 1 yr. averageTobacco (SNIP), Rye (SNIP) 0 .31Tobacco (SNIP), Rye (D) 028Numbers in parentheses indicate the number <strong>of</strong> years that the crop is grown consecutively.<strong>The</strong> abbreviations in parentheses are:FMP - fall moldboard plough;SNIP - spring moldboard plough;F chisel - fall chisel plough;D - disc.** <strong>The</strong> C values given are averages that were determined by summing the individual C values <strong>of</strong> all crops in the rotation <strong>and</strong> dividing thatnumber by the number <strong>of</strong> years in the rotation .
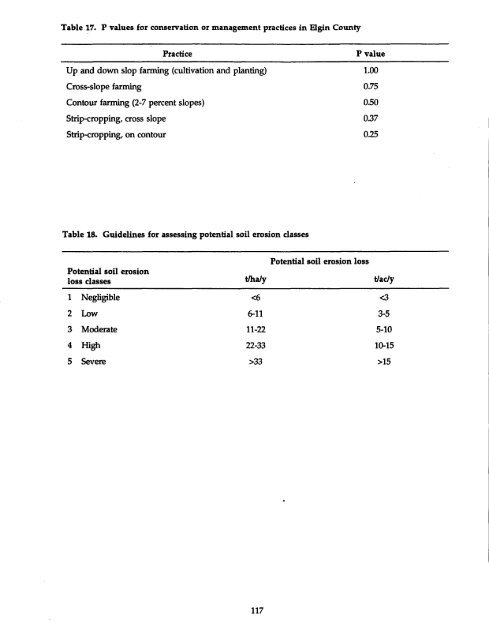
Table 17.P values for conservation or management practices in <strong>Elgin</strong> <strong>County</strong>PracticeP valueUp <strong>and</strong> down slop farming (cultivation <strong>and</strong> planting) 1 .00Cross-slope farming 0.75Contour fanning (2-7 percent slopes) 0.50Strip-cropping, cross slope 0.37Strip-cropping, on contour 0.25Table 18 .Guidelines for assessing potential soil erosion classesPotential soil erosionloss classes1 Negligiblet/ha/y33 >15