- Page 2 and 3:
Soil Biology Volume 18 Series Edito
- Page 4 and 5:
Ajit Varma l Amit C. Kharkwal Edito
- Page 6 and 7:
Foreword So old, so new... More tha
- Page 8 and 9:
Foreword vii Little AE, Robinson CJ
- Page 10 and 11:
x Preface work in this challenging
- Page 12 and 13:
xii Contents 9 Role of Root Exudate
- Page 14 and 15:
Contributors L.K. Abbott School of
- Page 16 and 17:
Contributors xvii Falko Feldmann Ju
- Page 18 and 19:
Contributors xix K. Nara Asian Natu
- Page 20 and 21:
Contributors xxi Marc St-Arnaud Ins
- Page 22 and 23:
2 A. Das and A. Varma Fig. 1.1 Type
- Page 24 and 25:
4 A. Das and A. Varma the scientifi
- Page 26 and 27:
6 A. Das and A. Varma 1.3.2 Symbiot
- Page 28 and 29:
8 A. Das and A. Varma all the root
- Page 30 and 31:
10 A. Das and A. Varma 1. Such poly
- Page 32 and 33:
12 A. Das and A. Varma 1.3.3.9 Nitr
- Page 34 and 35:
14 A. Das and A. Varma about 1-2 mm
- Page 36 and 37:
16 A. Das and A. Varma fixed nitrog
- Page 38 and 39:
18 A. Das and A. Varma Mycorrhizae
- Page 40 and 41:
20 A. Das and A. Varma Fig. 1.6 Dia
- Page 42 and 43:
22 A. Das and A. Varma a b Root hai
- Page 44 and 45:
24 A. Das and A. Varma intracellula
- Page 46 and 47:
26 A. Das and A. Varma Becker A, Ni
- Page 48 and 49:
28 A. Das and A. Varma Trappe JM, B
- Page 50 and 51: 30 A. Jumpponen were once active in
- Page 52 and 53: 32 A. Jumpponen GA, USA) to avoid d
- Page 54 and 55: 34 A. Jumpponen 2.2.3.6 Cloning, Se
- Page 56 and 57: 36 A. Jumpponen Table 2.1 Fungi det
- Page 58 and 59: 38 A. Jumpponen of the community st
- Page 60 and 61: 40 A. Jumpponen Girvan MS, Bullimor
- Page 62 and 63: 42 I.A.F. Djuuna et al. 1991). Crop
- Page 64 and 65: 44 I.A.F. Djuuna et al. 3.2.2 Indir
- Page 66 and 67: 46 I.A.F. Djuuna et al. Mycorrhiza
- Page 68 and 69: 48 I.A.F. Djuuna et al. Boomsma CR,
- Page 70 and 71: 50 I.A.F. Djuuna et al. Saito M (19
- Page 72 and 73: 52 M. Giovannetti et al. evidenced
- Page 74 and 75: 54 M. Giovannetti et al. a c e Ster
- Page 76 and 77: 56 M. Giovannetti et al. 4.2.4 Rema
- Page 78 and 79: 58 M. Giovannetti et al. a b c Fig.
- Page 80 and 81: 60 M. Giovannetti et al. to 4.1 mm
- Page 82 and 83: 62 M. Giovannetti et al. The detect
- Page 84 and 85: 64 M. Giovannetti et al. Jones MD,
- Page 86 and 87: 66 A. Gobert and C. Plassard NO3 fl
- Page 88 and 89: 68 A. Gobert and C. Plassard After
- Page 90 and 91: 70 A. Gobert and C. Plassard with k
- Page 92 and 93: 72 A. Gobert and C. Plassard 10 9 2
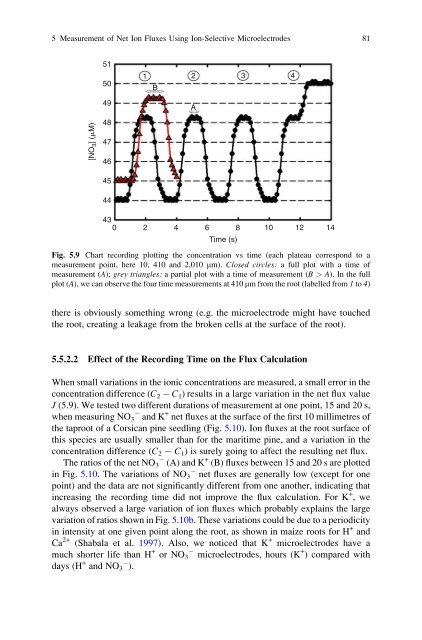
- Page 94 and 95: 74 A. Gobert and C. Plassard Fig. 5
- Page 96 and 97: 76 A. Gobert and C. Plassard connec
- Page 98 and 99: 78 A. Gobert and C. Plassard any ti
- Page 102 and 103: 82 A. Gobert and C. Plassard a Rati
- Page 104 and 105: 84 A. Gobert and C. Plassard - upta
- Page 106 and 107: 86 A. Gobert and C. Plassard Table
- Page 108 and 109: 88 A. Gobert and C. Plassard Newman
- Page 110 and 111: 90 I.M. van Aarle as mycorrhizal hy
- Page 112 and 113: 92 I.M. van Aarle a wash buffer. Th
- Page 114 and 115: 94 I.M. van Aarle l Usually 20-50 m
- Page 116 and 117: 96 I.M. van Aarle Fig. 6.1 Extramat
- Page 118 and 119: 98 I.M. van Aarle A disadvantage of
- Page 120 and 121: Chapter 7 In Vitro Compartmented Sy
- Page 122 and 123: 7 In Vitro Compartmented Systems to
- Page 124 and 125: 7 In Vitro Compartmented Systems to
- Page 126 and 127: 7 In Vitro Compartmented Systems to
- Page 128 and 129: 7 In Vitro Compartmented Systems to
- Page 130 and 131: 7 In Vitro Compartmented Systems to
- Page 132 and 133: 7 In Vitro Compartmented Systems to
- Page 134 and 135: 7 In Vitro Compartmented Systems to
- Page 136 and 137: 7 In Vitro Compartmented Systems to
- Page 138 and 139: 7 In Vitro Compartmented Systems to
- Page 140 and 141: 7 In Vitro Compartmented Systems to
- Page 142 and 143: Chapter 8 Use of the Autofluorescen
- Page 144 and 145: 8 Use of the Autofluorescence Prope
- Page 146 and 147: 8 Use of the Autofluorescence Prope
- Page 148 and 149: 8 Use of the Autofluorescence Prope
- Page 150 and 151:
8 Use of the Autofluorescence Prope
- Page 152 and 153:
8 Use of the Autofluorescence Prope
- Page 154 and 155:
8 Use of the Autofluorescence Prope
- Page 156 and 157:
8 Use of the Autofluorescence Prope
- Page 158 and 159:
8 Use of the Autofluorescence Prope
- Page 160 and 161:
Chapter 9 Role of Root Exudates and
- Page 162 and 163:
9 Role of Root Exudates and Rhizosp
- Page 164 and 165:
9 Role of Root Exudates and Rhizosp
- Page 166 and 167:
9 Role of Root Exudates and Rhizosp
- Page 168 and 169:
9 Role of Root Exudates and Rhizosp
- Page 170 and 171:
9 Role of Root Exudates and Rhizosp
- Page 172 and 173:
9 Role of Root Exudates and Rhizosp
- Page 174 and 175:
9 Role of Root Exudates and Rhizosp
- Page 176 and 177:
9 Role of Root Exudates and Rhizosp
- Page 178 and 179:
Chapter 10 Assessing the Mycorrhiza
- Page 180 and 181:
10 Assessing the Mycorrhizal Divers
- Page 182 and 183:
10 Assessing the Mycorrhizal Divers
- Page 184 and 185:
10 Assessing the Mycorrhizal Divers
- Page 186 and 187:
10 Assessing the Mycorrhizal Divers
- Page 188 and 189:
10 Assessing the Mycorrhizal Divers
- Page 190 and 191:
10 Assessing the Mycorrhizal Divers
- Page 192 and 193:
10 Assessing the Mycorrhizal Divers
- Page 194:
10 Assessing the Mycorrhizal Divers
- Page 197 and 198:
178 D. Krüger et al. 8. Wash the p
- Page 199 and 200:
180 D. Krüger et al. Table 10.1 Ty
- Page 201 and 202:
182 D. Krüger et al. appear are in
- Page 203 and 204:
184 D. Krüger et al. tool such as
- Page 205 and 206:
186 D. Krüger et al. Ishikawa J, T
- Page 207 and 208:
188 D. Krüger et al. Sammeth M, Ro
- Page 209 and 210:
190 Z.M. Solaiman hyphae have been
- Page 211 and 212:
192 Z.M. Solaiman 11.2.2 Isolation
- Page 213 and 214:
194 Z.M. Solaiman 11.3 Conclusions
- Page 215 and 216:
Chapter 12 Interaction with Soil Mi
- Page 217 and 218:
12 Interaction with Soil Microorgan
- Page 219 and 220:
12 Interaction with Soil Microorgan
- Page 221 and 222:
12 Interaction with Soil Microorgan
- Page 223 and 224:
12 Interaction with Soil Microorgan
- Page 225 and 226:
12 Interaction with Soil Microorgan
- Page 227 and 228:
12 Interaction with Soil Microorgan
- Page 229 and 230:
Chapter 13 Isolation, Cultivation a
- Page 231 and 232:
13 Isolation, Cultivation and In Pl
- Page 233 and 234:
13 Isolation, Cultivation and In Pl
- Page 235 and 236:
13 Isolation, Cultivation and In Pl
- Page 237 and 238:
13 Isolation, Cultivation and In Pl
- Page 239 and 240:
13 Isolation, Cultivation and In Pl
- Page 241 and 242:
13 Isolation, Cultivation and In Pl
- Page 243 and 244:
13 Isolation, Cultivation and In Pl
- Page 245 and 246:
228 K. Vogel-Mikusˇ et al. only be
- Page 247 and 248:
230 K. Vogel-Mikusˇ et al. Fig. 14
- Page 249 and 250:
232 K. Vogel-Mikusˇ et al. such sp
- Page 251 and 252:
234 K. Vogel-Mikusˇ et al. STIM de
- Page 253 and 254:
236 K. Vogel-Mikusˇ et al. transfe
- Page 255 and 256:
Table 14.1 Element concentrations w
- Page 257 and 258:
240 K. Vogel-Mikusˇ et al. Fig. 14
- Page 259 and 260:
242 K. Vogel-Mikusˇ et al. Frey B,
- Page 261 and 262:
244 E. Dumas-Gaudot et al. TEMED N,
- Page 263 and 264:
246 E. Dumas-Gaudot et al. system i
- Page 265 and 266:
248 E. Dumas-Gaudot et al. Bromophe
- Page 267 and 268:
250 E. Dumas-Gaudot et al. taken to
- Page 269 and 270:
252 E. Dumas-Gaudot et al. Note 6:
- Page 271 and 272:
254 E. Dumas-Gaudot et al. by Bradf
- Page 273 and 274:
256 E. Dumas-Gaudot et al. 3. Take
- Page 275 and 276:
258 E. Dumas-Gaudot et al. solubili
- Page 277 and 278:
260 E. Dumas-Gaudot et al. Table 15
- Page 279 and 280:
262 E. Dumas-Gaudot et al. Table 15
- Page 281 and 282:
264 E. Dumas-Gaudot et al. Followin
- Page 283 and 284:
266 E. Dumas-Gaudot et al. Once hom
- Page 285 and 286:
268 E. Dumas-Gaudot et al. to both
- Page 287 and 288:
270 E. Dumas-Gaudot et al. were the
- Page 289 and 290:
272 E. Dumas-Gaudot et al. Dumas-Ga
- Page 291 and 292:
274 E. Dumas-Gaudot et al. Valot B,
- Page 293 and 294:
276 P.A. Olsson Fig. 16.1 Schematic
- Page 295 and 296:
278 P.A. Olsson Furthermore, C tran
- Page 297 and 298:
280 P.A. Olsson in AM fungi and a h
- Page 299 and 300:
282 P.A. Olsson (Graham et al. 1995
- Page 301 and 302:
284 P.A. Olsson Nakano A, Takahashi
- Page 303 and 304:
286 X.H. He et al. In many cases, N
- Page 305 and 306:
288 X.H. He et al. Table 17.1 Exper
- Page 307 and 308:
290 X.H. He et al. 17.3.1.1 Comment
- Page 309 and 310:
Chapter 18 Analyses of Ecophysiolog
- Page 311 and 312:
18 Analyses of Ecophysiological Tra
- Page 313 and 314:
18 Analyses of Ecophysiological Tra
- Page 315 and 316:
18 Analyses of Ecophysiological Tra
- Page 317 and 318:
18 Analyses of Ecophysiological Tra
- Page 319 and 320:
18 Analyses of Ecophysiological Tra
- Page 321 and 322:
18 Analyses of Ecophysiological Tra
- Page 323 and 324:
308 I. Brito et al. fungi, little i
- Page 325 and 326:
310 I. Brito et al. 60% of moisture
- Page 327 and 328:
312 I. Brito et al. Thompson 1990;
- Page 329 and 330:
314 I. Brito et al. 19.8 Crop Rotat
- Page 331 and 332:
316 I. Brito et al. References Abbo
- Page 333 and 334:
318 I. Brito et al. Smith SE, Read
- Page 335 and 336:
320 F. Feldmann et al. inoculum of
- Page 337 and 338:
322 F. Feldmann et al. Table 20.1 B
- Page 339 and 340:
324 F. Feldmann et al. transferred
- Page 341 and 342:
326 F. Feldmann et al. 20.3.3 The A
- Page 343 and 344:
328 F. Feldmann et al. Inoculum is
- Page 345 and 346:
330 F. Feldmann et al. Fig. 20.5 Pr
- Page 347 and 348:
332 F. Feldmann et al. value for th
- Page 349 and 350:
334 F. Feldmann et al. of abiotic a
- Page 351 and 352:
336 F. Feldmann et al. Lackie SM, B
- Page 353 and 354:
338 M. Vestberg and A.C. Cassells b
- Page 355 and 356:
340 M. Vestberg and A.C. Cassells M
- Page 357 and 358:
342 M. Vestberg and A.C. Cassells a
- Page 359 and 360:
344 M. Vestberg and A.C. Cassells T
- Page 361 and 362:
346 M. Vestberg and A.C. Cassells d
- Page 363 and 364:
348 M. Vestberg and A.C. Cassells M
- Page 365 and 366:
350 M. Vestberg and A.C. Cassells 2
- Page 367 and 368:
352 M. Vestberg and A.C. Cassells 2
- Page 369 and 370:
354 M. Vestberg and A.C. Cassells C
- Page 371 and 372:
356 M. Vestberg and A.C. Cassells G
- Page 373 and 374:
358 M. Vestberg and A.C. Cassells P
- Page 375 and 376:
360 M. Vestberg and A.C. Cassells V
- Page 377 and 378:
362 A. Baldi et al. the capabilitie
- Page 379 and 380:
364 A. Baldi et al. 22.2.3 Initiati
- Page 381 and 382:
366 A. Baldi et al. 2. Place inocul
- Page 383 and 384:
368 A. Baldi et al. 22.5 Analysis 2
- Page 385 and 386:
370 A. Baldi et al. 22.5.4 Phenylal
- Page 387 and 388:
372 A. Baldi et al. Nicholas JB, Jo
- Page 389 and 390:
374 A. Baldi et al. Among these, fu
- Page 391 and 392:
376 A. Baldi et al. 3. Place one ex
- Page 393 and 394:
378 A. Baldi et al. 23.4 Analysis F
- Page 395 and 396:
380 A. Baldi et al. Chattopadhyay S
- Page 397 and 398:
382 A. Sirrenberg et al. physical c
- Page 399 and 400:
384 A. Sirrenberg et al. Fig. 24.1
- Page 401 and 402:
386 A. Sirrenberg et al. Fig. 24.2
- Page 403 and 404:
388 A. Sirrenberg et al. Fig. 24.3
- Page 405 and 406:
390 A. Sirrenberg et al. in Fig. 24
- Page 407 and 408:
392 A. Sirrenberg et al. 24.5.2 Tru
- Page 409 and 410:
394 K. Haselwandter and G. Winkelma
- Page 411 and 412:
396 K. Haselwandter and G. Winkelma
- Page 413 and 414:
398 K. Haselwandter and G. Winkelma
- Page 415 and 416:
400 K. Haselwandter and G. Winkelma
- Page 417 and 418:
402 K. Haselwandter and G. Winkelma
- Page 419 and 420:
404 E. Mohammadi Goltapeh et al. Fi
- Page 421 and 422:
406 E. Mohammadi Goltapeh et al. Th
- Page 423 and 424:
408 E. Mohammadi Goltapeh et al. 26
- Page 425 and 426:
410 E. Mohammadi Goltapeh et al. co
- Page 427 and 428:
412 E. Mohammadi Goltapeh et al. Tw
- Page 429 and 430:
414 E. Mohammadi Goltapeh et al. Co
- Page 431 and 432:
416 E. Mohammadi Goltapeh et al. qu
- Page 433 and 434:
418 E. Mohammadi Goltapeh et al. 26
- Page 435 and 436:
420 E. Mohammadi Goltapeh et al. Ch
- Page 437 and 438:
Index A A. bisporus var. burnettii,
- Page 439 and 440:
Index 425 Dark septate root endophy
- Page 441 and 442:
Index 427 Leghemoglobin, 11 Lentinu
- Page 443 and 444:
Index 429 Proteomics, 244 Protoplas