prospectus for - Pumpkin Patch investor relations
prospectus for - Pumpkin Patch investor relations
prospectus for - Pumpkin Patch investor relations
- No tags were found...

You also want an ePaper? Increase the reach of your titles
YUMPU automatically turns print PDFs into web optimized ePapers that Google loves.
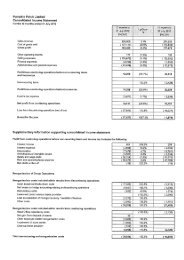
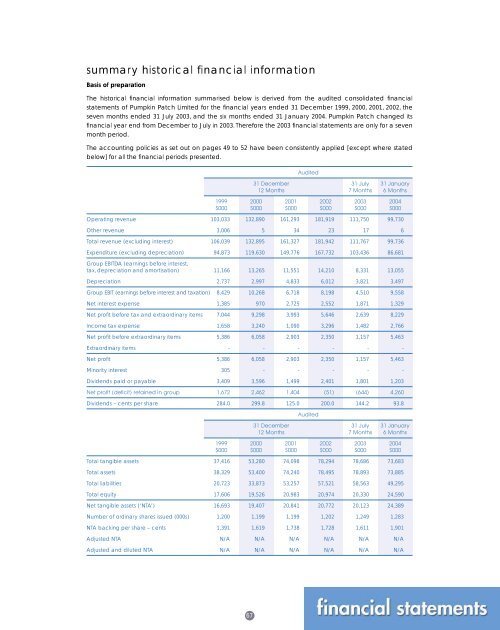
summary historical financial in<strong>for</strong>mationBasis of preparationThe historical financial in<strong>for</strong>mation summarised below is derived from the audited consolidated financialstatements of <strong>Pumpkin</strong> <strong>Patch</strong> Limited <strong>for</strong> the financial years ended 31 December 1999, 2000, 2001, 2002, theseven months ended 31 July 2003, and the six months ended 31 January 2004. <strong>Pumpkin</strong> <strong>Patch</strong> changed itsfinancial year end from December to July in 2003. There<strong>for</strong>e the 2003 financial statements are only <strong>for</strong> a sevenmonth period.The accounting policies as set out on pages 49 to 52 have been consistently applied [except where statedbelow] <strong>for</strong> all the financial periods presented.Audited31 December 31 July 31 January12 Months 7 Months 6 Months1999 2000 2001 2002 2003 2004$000 $000 $000 $000 $000 $000Operating revenue 103,033 132,890 161,293 181,919 111,750 99,730Other revenue 3,006 5 34 23 17 6Total revenue (excluding interest) 106,039 132,895 161,327 181,942 111,767 99,736Expenditure (excluding depreciation) 94,873 119,630 149,776 167,732 103,436 86,681Group EBITDA (earnings be<strong>for</strong>e interest,tax, depreciation and amortisation) 11,166 13,265 11,551 14,210 8,331 13,055Depreciation 2,737 2,997 4,833 6,012 3,821 3,497Group EBIT (earnings be<strong>for</strong>e interest and taxation) 8,429 10,268 6,718 8,198 4,510 9,558Net interest expense 1,385 970 2,725 2,552 1,871 1,329Net profit be<strong>for</strong>e tax and extraordinary items 7,044 9,298 3,993 5,646 2,639 8,229Income tax expense 1,658 3,240 1,090 3,296 1,482 2,766Net profit be<strong>for</strong>e extraordinary items 5,386 6,058 2,903 2,350 1,157 5,463Extraordinary items - - - - - -Net profit 5,386 6,058 2,903 2,350 1,157 5,463Minority interest 305 - - - - -Dividends paid or payable 3,409 3,596 1,499 2,401 1,801 1,203Net profit (deficit) retained in group 1,672 2,462 1,404 (51) (644) 4,260Dividends – cents per share 284.0 299.8 125.0 200.0 144.2 93.8Audited31 December 31 July 31 January12 Months 7 Months 6 Months1999 2000 2001 2002 2003 2004$000 $000 $000 $000 $000 $000Total tangible assets 37,416 53,280 74,098 78,294 78,686 73,683Total assets 38,329 53,400 74,240 78,495 78,893 73,885Total liabilities 20,723 33,873 53,257 57,521 58,563 49,295Total equity 17,606 19,526 20,983 20,974 20,330 24,590Net tangible assets (‘NTA’) 16,693 19,407 20,841 20,772 20,123 24,389Number of ordinary shares issued (000s) 1,200 1,199 1,199 1,202 1,249 1,283NTA backing per share – cents 1,391 1,619 1,738 1,728 1,611 1,901Adjusted NTA N/A N/A N/A N/A N/A N/AAdjusted and diluted NTA N/A N/A N/A N/A N/A N/A67