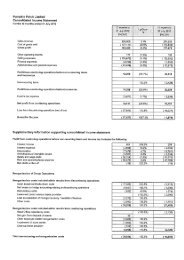
SUMMARY HISTORICAL FINANCIAL INFORMATION (CONTINUED)Notes1. Number of ordinary shares issued at 31 July 2003 and 31 January 2004 include C Class shares that are notentitled to receive dividends. There were 47,350 and 79,250 C Class shares on issue at 31 July 2003 and31 January 2004 respectively. Excluding the C Class shares the dividends paid in cents per share were 150and 100 cents per share in 2003 and 2004, respectively.2. In accordance wiith clause 8(5) of the First Schedule to the Regulations, set out below is the adjusted anddiluted net tangible asset backing per share as at 31 January 2004.Proceeds From 32,000,000 shares (a)Proceeds From 60,770,399 shares (b)Assumed Adjusted NTA Adjusted and Diluted NTA Adjusted NTA Adjusted and Diluted NTAFinal Price Backing Per Share Backing Per Share Backing Per Share Backing Per Share$1.20 $0.37 $0.38 $0.49 $0.50$1.30 $0.39 $0.40 $0.52 $0.53$1.40 $0.41 $0.42 $0.55 $0.56The above table has been calculated based on the following assumptions:(a)(b)(c)(d)(e)All new shares (81,027,200) have been allotted and the maximum number of shares have beenrepurchased (49,027,200), assuming Final Price of $1.20, $1.30 and $1.40.The Board reserves the rightto set the Final Price outside of the Indicative Price Range;60,779,399 shares are subscribed <strong>for</strong> by <strong>investor</strong>s and the Company, at its discretion, retains allproceeds rather than returning proceeds from all shares over 32,000,000 to <strong>investor</strong>s (i.e. the numberof shares subscribed <strong>for</strong> is less than the repurchase threshold described on pages 81 and 82);The 100:1 share split (described on page 79) has occurred, offer related costs of $1,335k wereincurred which reduced equity;The shares to be issued under the DF7 Share Scheme had been allotted and the proceedsreceived be<strong>for</strong>e that date; andThe adjusted and diluted NTA backing per share assumes, in addition to (a) to (d) above, theOptions have been allotted and proceeds received.3. The other revenue in 1999 largely comprises a profit on sale of the current head office, warehouse andlogistics facility at 439 East Tamaki Road, Auckland. The property was sold to a third party.4. During 1999, PPL Group exited the Studio Works stores. Below is a table of the historical discontinuingactivities details. Some costs associated with exiting the stores, such as the write-off of inventory and fixedassets, were recognised in the 1999 results, with the remainder of the exiting costs being incurred in 2000with the completion of the exiting process.31 December 31 July 31 January12 Months 7 Months 6 MonthsDiscontinued Activities 1999 2000 2001 2002 2003 2004$000 $000 $000 $000 $000 $000Revenue (included in operating revenue) 5,827 2,124 - - - -Expenditure (included in expenditure) (7,493) (2,124) - - - -Cost of exiting activity (included in expenditure) (830) (361) - - - -Income tax benefit (included in tax expense) 823 - - - - -Net Loss from Discontinued Activities (1,673) (361) - - - -5. Amounts presented <strong>for</strong> net interest above include both interest income and interest expenses. Theindividual interest income and interest expense amounts <strong>for</strong> each period are presented below.The higherinterest charges from 2001 are a consequence of higher debt used to fund additional growth in the business.31 December 31 July 31 January12 Months 7 Months 6 MonthsNet Interest 1999 2000 2001 2002 2003 2004$000 $000 $000 $000 $000 $000Interest revenue 10 38 257 18 - 6Interest expense (1,395) (1,008) (2,982) (2,570) (1,871) (1,335)Net Interest (1,385) (970) (2,725) (2,552) (1,871) (1,329)68
SUMMARY HISTORICAL FINANCIAL INFORMATION (CONTINUED)6. During the 2000 and 2001 periods the group entered into transactions with a related company, <strong>Pumpkin</strong><strong>Patch</strong> Limited (UK). A summary of these transactions are presented below.31 December12 MonthsRelated party transactions 2000 2001$000 $000Statement of Financial Per<strong>for</strong>manceSale of inventory to <strong>Pumpkin</strong> <strong>Patch</strong> Limited (UK) 1,678 6,621Franchise royalties charged to <strong>Pumpkin</strong> <strong>Patch</strong> Limited (UK) - 301Management fees charged to <strong>Pumpkin</strong> <strong>Patch</strong> Limited (UK) 37 630Statement of Financial PositionReceivable from <strong>Pumpkin</strong> <strong>Patch</strong> Limited (UK) 3,948 7,7377. In 2001 the Group changed its accounting policy regarding fit-out contributions received from landlords.Prior to 2001 contributions were either capitalised and taken to income at a later date or taken toincome in full upon receipt of the contribution. The new policy required that all contributions must beinitially capitalised and then recognised in the statement of financial per<strong>for</strong>mance over the minimumperiod of the lease as a reduction in operating lease costs. The lease periods average 5 years.The table below summarises the net impact on the reported results of the company resulting from thechange in accounting policy.31 December 31 July 31 January12 Months 7 Months 6 Months1999 2000 2001 2002 2003 2004$000 $000 $000 $000 $000 $000Net impact of change in policy - (1,058) 318 (170) (381) (2)8. In 2002 the group acquired 100% of the shares in <strong>Pumpkin</strong> <strong>Patch</strong> Limited (UK) <strong>for</strong> cash consideration of$40,789. The table below details the transaction. The 2002 results not only include amortisation of goodwillof $307,577 but also a write-off of $1,230,309 relating to the balance of goodwill on the purchase of<strong>Pumpkin</strong> <strong>Patch</strong> Limited (UK). The charge was deemed necessary by the Directors after they reviewed thecarrying value of the subsidiary and recognising that the purchase was made primarily as part of overallrestructuring of group ownership structures.Acquisition of PPL (UK)NZ$’000 2002Cash & bank 547Net current assets 2,797Fixed assets 2,699Borrowings (7,540)Net Liabilities Acquired (1,497)Cash consideration 41Goodwill on Acquisition 1,5389. The results include trading losses attributable to <strong>Pumpkin</strong> <strong>Patch</strong> Limited (UK).2002 2003 200412 Months 7 Months 6 Months$000 $000 $000Trading losses attributed to <strong>Pumpkin</strong> <strong>Patch</strong> (UK) 1,445 1,958 59910. The growth in total assets and liabilities over the periods relate to growth in store numbers, their associatedworking capital items (e.g. inventory, accounts payable), and use of debt to fund asset growth.69