

PDF: 1352 KB - Bureau of Infrastructure, Transport and Regional ...
PDF: 1352 KB - Bureau of Infrastructure, Transport and Regional ...
PDF: 1352 KB - Bureau of Infrastructure, Transport and Regional ...
- No tags were found...

You also want an ePaper? Increase the reach of your titles
YUMPU automatically turns print PDFs into web optimized ePapers that Google loves.
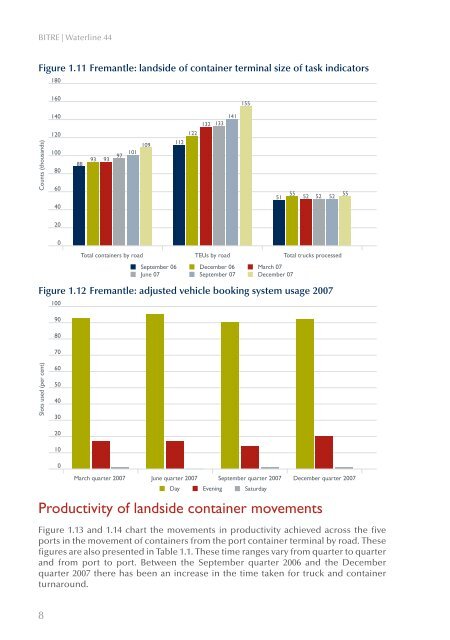
BITRE | Waterline 44Figure 1.11 Fremantle: l<strong>and</strong>side <strong>of</strong> container terminal size <strong>of</strong> task indicators180160155Counts (thous<strong>and</strong>s)1401201008060408893 9397 101 109112122132 133141515552 52 5255200Total containers by roadTEUs by roadSeptember 06 December 06 March 07June 07 September 07 December 07Total trucks processedFigure 1.12 Fremantle: adjusted vehicle booking system usage 2007100908070Slots used (per cent)6050403020100March quarter 2007June quarter 2007September quarter 2007Day Evening SaturdayProductivity <strong>of</strong> l<strong>and</strong>side container movementsDecember quarter 2007Figure 1.13 <strong>and</strong> 1.14 chart the movements in productivity achieved across the fiveports in the movement <strong>of</strong> containers from the port container terminal by road. Thesefigures are also presented in Table 1.1. These time ranges vary from quarter to quarter<strong>and</strong> from port to port. Between the September quarter 2006 <strong>and</strong> the Decemberquarter 2007 there has been an increase in the time taken for truck <strong>and</strong> containerturnaround.8


