

PDF: 1352 KB - Bureau of Infrastructure, Transport and Regional ...
PDF: 1352 KB - Bureau of Infrastructure, Transport and Regional ...
PDF: 1352 KB - Bureau of Infrastructure, Transport and Regional ...
- No tags were found...

Create successful ePaper yourself
Turn your PDF publications into a flip-book with our unique Google optimized e-Paper software.
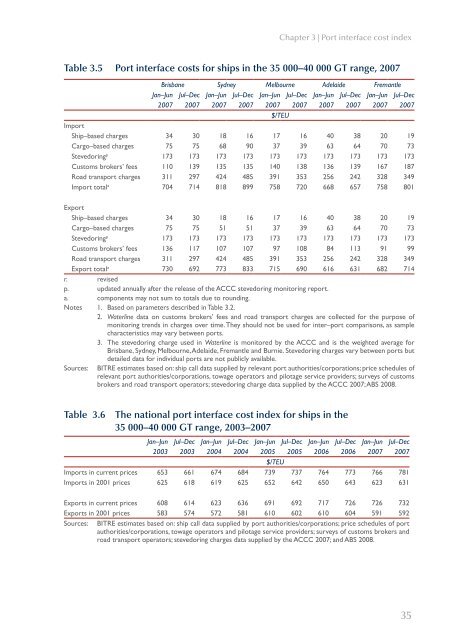
Chapter 3 | Port interface cost indexTable 3.5 Port interface costs for ships in the 35 000–40 000 GT range, 2007Brisbane Sydney Melbourne Adelaide FremantleJan–Jun Jul–Dec Jan–Jun Jul–Dec Jan–Jun Jul–Dec Jan–Jun Jul–Dec Jan–Jun Jul–Dec2007 2007 2007 2007 2007 2007 2007 2007 2007 2007$/TEUImportShip–based charges 34 30 18 16 17 16 40 38 20 19Cargo–based charges 75 75 68 90 37 39 63 64 70 73Stevedoring p 173 173 173 173 173 173 173 173 173 173Customs brokers’ fees 110 139 135 135 140 138 136 139 167 187Road transport charges 311 297 424 485 391 353 256 242 328 349Import total a 704 714 818 899 758 720 668 657 758 801ExportShip–based charges 34 30 18 16 17 16 40 38 20 19Cargo–based charges 75 75 51 51 37 39 63 64 70 73Stevedoring p 173 173 173 173 173 173 173 173 173 173Customs brokers’ fees 136 117 107 107 97 108 84 113 91 99Road transport charges 311 297 424 485 391 353 256 242 328 349Export total a 730 692 773 833 715 690 616 631 682 714r. revisedp. updated annually after the release <strong>of</strong> the ACCC stevedoring monitoring report.a. components may not sum to totals due to rounding.Notes 1. Based on parameters described in Table 3.2.2. Waterline data on customs brokers’ fees <strong>and</strong> road transport charges are collected for the purpose <strong>of</strong>monitoring trends in charges over time. They should not be used for inter–port comparisons, as samplecharacteristics may vary between ports.3. The stevedoring charge used in Waterline is monitored by the ACCC <strong>and</strong> is the weighted average forBrisbane, Sydney, Melbourne, Adelaide, Fremantle <strong>and</strong> Burnie. Stevedoring charges vary between ports butdetailed data for individual ports are not publicly available.Sources: BITRE estimates based on: ship call data supplied by relevant port authorities/corporations; price schedules <strong>of</strong>relevant port authorities/corporations, towage operators <strong>and</strong> pilotage service providers; surveys <strong>of</strong> customsbrokers <strong>and</strong> road transport operators; stevedoring charge data supplied by the ACCC 2007; ABS 2008.Table 3.6 The national port interface cost index for ships in the35 000–40 000 GT range, 2003–2007Jan–Jun Jul–Dec Jan–Jun Jul–Dec Jan–Jun Jul–Dec Jan–Jun Jul–Dec Jan–Jun Jul–Dec2003 2003 2004 2004 2005 2005 2006 2006 2007 2007$/TEUImports in current prices 653 661 674 684 739 737 764 773 766 781Imports in 2001 prices 625 618 619 625 652 642 650 643 623 631Exports in current prices 608 614 623 636 691 692 717 726 726 732Exports in 2001 prices 583 574 572 581 610 602 610 604 591 592Sources: BITRE estimates based on: ship call data supplied by port authorities/corporations; price schedules <strong>of</strong> portauthorities/corporations, towage operators <strong>and</strong> pilotage service providers; surveys <strong>of</strong> customs brokers <strong>and</strong>road transport operators; stevedoring charges data supplied by the ACCC 2007; <strong>and</strong> ABS 2008.35


