

PDF: 1352 KB - Bureau of Infrastructure, Transport and Regional ...
PDF: 1352 KB - Bureau of Infrastructure, Transport and Regional ...
PDF: 1352 KB - Bureau of Infrastructure, Transport and Regional ...
- No tags were found...

Create successful ePaper yourself
Turn your PDF publications into a flip-book with our unique Google optimized e-Paper software.
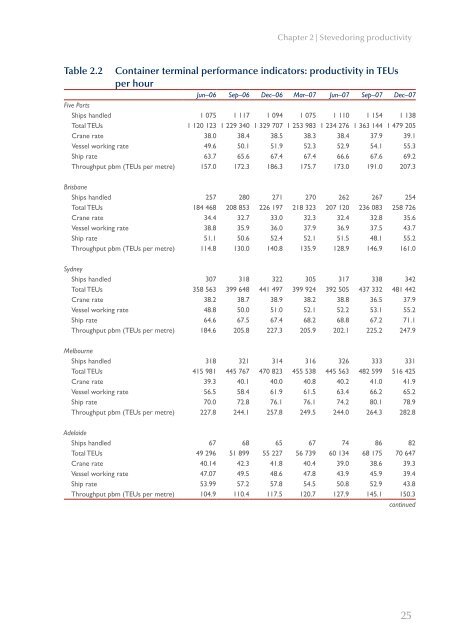
Chapter 2 | Stevedoring productivityTable 2.2Container terminal performance indicators: productivity in TEUsper hourJun–06 Sep–06 Dec–06 Mar–07 Jun–07 Sep–07 Dec–07Five PortsShips h<strong>and</strong>led 1 075 1 117 1 094 1 075 1 110 1 154 1 138Total TEUs 1 120 123 1 229 340 1 329 707 1 253 983 1 234 276 1 363 144 1 479 205Crane rate 38.0 38.4 38.5 38.3 38.4 37.9 39.1Vessel working rate 49.6 50.1 51.9 52.3 52.9 54.1 55.3Ship rate 63.7 65.6 67.4 67.4 66.6 67.6 69.2Throughput pbm (TEUs per metre) 157.0 172.3 186.3 175.7 173.0 191.0 207.3BrisbaneShips h<strong>and</strong>led 257 280 271 270 262 267 254Total TEUs 184 468 208 853 226 197 218 323 207 120 236 083 258 726Crane rate 34.4 32.7 33.0 32.3 32.4 32.8 35.6Vessel working rate 38.8 35.9 36.0 37.9 36.9 37.5 43.7Ship rate 51.1 50.6 52.4 52.1 51.5 48.1 55.2Throughput pbm (TEUs per metre) 114.8 130.0 140.8 135.9 128.9 146.9 161.0SydneyShips h<strong>and</strong>led 307 318 322 305 317 338 342Total TEUs 358 563 399 648 441 497 399 924 392 505 437 332 481 442Crane rate 38.2 38.7 38.9 38.2 38.8 36.5 37.9Vessel working rate 48.8 50.0 51.0 52.1 52.2 53.1 55.2Ship rate 64.6 67.5 67.4 68.2 68.8 67.2 71.1Throughput pbm (TEUs per metre) 184.6 205.8 227.3 205.9 202.1 225.2 247.9MelbourneShips h<strong>and</strong>led 318 321 314 316 326 333 331Total TEUs 415 981 445 767 470 823 455 538 445 563 482 599 516 425Crane rate 39.3 40.1 40.0 40.8 40.2 41.0 41.9Vessel working rate 56.5 58.4 61.9 61.5 63.4 66.2 65.2Ship rate 70.0 72.8 76.1 76.1 74.2 80.1 78.9Throughput pbm (TEUs per metre) 227.8 244.1 257.8 249.5 244.0 264.3 282.8AdelaideShips h<strong>and</strong>led 67 68 65 67 74 86 82Total TEUs 49 296 51 899 55 227 56 739 60 134 68 175 70 647Crane rate 40.14 42.3 41.8 40.4 39.0 38.6 39.3Vessel working rate 47.07 49.5 48.6 47.8 43.9 45.9 39.4Ship rate 53.99 57.2 57.8 54.5 50.8 52.9 43.8Throughput pbm (TEUs per metre) 104.9 110.4 117.5 120.7 127.9 145.1 150.3continued25


