

PDF: 1352 KB - Bureau of Infrastructure, Transport and Regional ...
PDF: 1352 KB - Bureau of Infrastructure, Transport and Regional ...
PDF: 1352 KB - Bureau of Infrastructure, Transport and Regional ...
- No tags were found...

You also want an ePaper? Increase the reach of your titles
YUMPU automatically turns print PDFs into web optimized ePapers that Google loves.
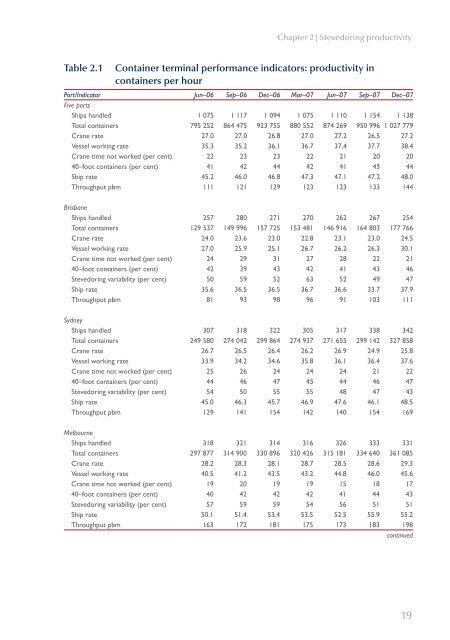
Chapter 2 | Stevedoring productivityTable 2.1Container terminal performance indicators: productivity incontainers per hourPort/Indicator Jun–06 Sep–06 Dec–06 Mar–07 Jun–07 Sep–07 Dec–07Five portsShips h<strong>and</strong>led 1 075 1 117 1 094 1 075 1 110 1 154 1 138Total containers 795 252 864 475 923 755 880 552 874 269 950 996 1 027 779Crane rate 27.0 27.0 26.8 27.0 27.2 26.5 27.2Vessel working rate 35.3 35.2 36.1 36.7 37.4 37.7 38.4Crane time not worked (per cent) 22 23 23 22 21 20 2040–foot containers (per cent) 41 42 44 42 41 43 44Ship rate 45.2 46.0 46.8 47.3 47.1 47.2 48.0Throughput pbm 111 121 129 123 123 133 144BrisbaneShips h<strong>and</strong>led 257 280 271 270 262 267 254Total containers 129 537 149 996 157 725 153 481 146 916 164 803 177 766Crane rate 24.0 23.6 23.0 22.8 23.1 23.0 24.5Vessel working rate 27.0 25.9 25.1 26.7 26.2 26.3 30.1Crane time not worked (per cent) 24 29 31 27 28 22 2140–foot containers (per cent) 42 39 43 42 41 43 46Stevedoring variability (per cent) 50 59 52 63 52 49 47Ship rate 35.6 36.5 36.5 36.7 36.6 33.7 37.9Throughput pbm 81 93 98 96 91 103 111SydneyShips h<strong>and</strong>led 307 318 322 305 317 338 342Total containers 249 580 274 042 299 864 274 937 271 655 299 142 327 858Crane rate 26.7 26.5 26.4 26.2 26.9 24.9 25.8Vessel working rate 33.9 34.2 34.6 35.8 36.1 36.4 37.6Crane time not worked (per cent) 25 26 24 24 24 21 2240–foot containers (per cent) 44 46 47 45 44 46 47Stevedoring variability (per cent) 54 50 55 55 48 47 43Ship rate 45.0 46.3 45.7 46.9 47.6 46.1 48.5Throughput pbm 129 141 154 142 140 154 169MelbourneShips h<strong>and</strong>led 318 321 314 316 326 333 331Total containers 297 877 314 900 330 896 320 426 315 181 334 640 361 085Crane rate 28.2 28.3 28.1 28.7 28.5 28.6 29.3Vessel working rate 40.5 41.2 43.5 43.2 44.8 46.0 45.6Crane time not worked (per cent) 19 20 19 19 15 18 1740–foot containers (per cent) 40 42 42 42 41 44 43Stevedoring variability (per cent) 57 59 59 54 56 51 51Ship rate 50.1 51.4 53.4 53.5 52.5 55.9 55.2Throughput pbm 163 172 181 175 173 183 198continued19


