PDF: 1352 KB - Bureau of Infrastructure, Transport and Regional ...
PDF: 1352 KB - Bureau of Infrastructure, Transport and Regional ...
PDF: 1352 KB - Bureau of Infrastructure, Transport and Regional ...
- No tags were found...
Create successful ePaper yourself
Turn your PDF publications into a flip-book with our unique Google optimized e-Paper software.
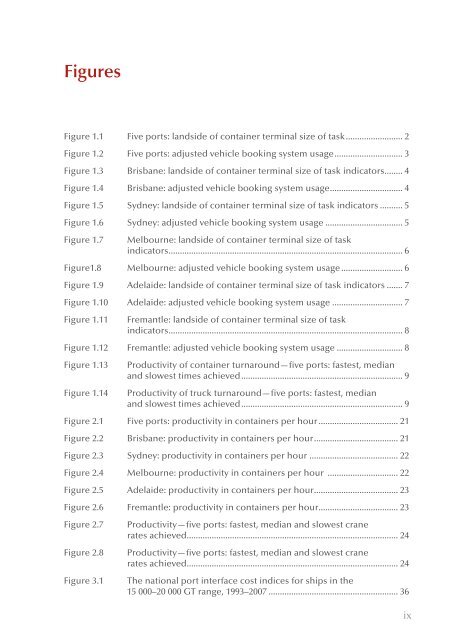
FiguresFigure 1.1 Five ports: l<strong>and</strong>side <strong>of</strong> container terminal size <strong>of</strong> task......................... 2Figure 1.2 Five ports: adjusted vehicle booking system usage.............................. 3Figure 1.3 Brisbane: l<strong>and</strong>side <strong>of</strong> container terminal size <strong>of</strong> task indicators........ 4Figure 1.4 Brisbane: adjusted vehicle booking system usage................................ 4Figure 1.5 Sydney: l<strong>and</strong>side <strong>of</strong> container terminal size <strong>of</strong> task indicators........... 5Figure 1.6 Sydney: adjusted vehicle booking system usage................................... 5Figure 1.7Melbourne: l<strong>and</strong>side <strong>of</strong> container terminal size <strong>of</strong> taskindicators....................................................................................................... 6Figure1.8 Melbourne: adjusted vehicle booking system usage............................ 6Figure 1.9 Adelaide: l<strong>and</strong>side <strong>of</strong> container terminal size <strong>of</strong> task indicators........ 7Figure 1.10 Adelaide: adjusted vehicle booking system usage................................ 7Figure 1.11Fremantle: l<strong>and</strong>side <strong>of</strong> container terminal size <strong>of</strong> taskindicators....................................................................................................... 8Figure 1.12 Fremantle: adjusted vehicle booking system usage.............................. 8Figure 1.13Figure 1.14Productivity <strong>of</strong> container turnaround—five ports: fastest, median<strong>and</strong> slowest times achieved........................................................................ 9Productivity <strong>of</strong> truck turnaround—five ports: fastest, median<strong>and</strong> slowest times achieved........................................................................ 9Figure 2.1 Five ports: productivity in containers per hour.................................... 21Figure 2.2 Brisbane: productivity in containers per hour..................................... 21Figure 2.3 Sydney: productivity in containers per hour ....................................... 22Figure 2.4 Melbourne: productivity in containers per hour ................................ 22Figure 2.5 Adelaide: productivity in containers per hour..................................... 23Figure 2.6 Fremantle: productivity in containers per hour................................... 23Figure 2.7Figure 2.8Figure 3.1Productivity—five ports: fastest, median <strong>and</strong> slowest cranerates achieved............................................................................................. 24Productivity—five ports: fastest, median <strong>and</strong> slowest cranerates achieved............................................................................................. 24The national port interface cost indices for ships in the15 000–20 000 GT range, 1993–2007.......................................................... 36ix


