

PDF: 1352 KB - Bureau of Infrastructure, Transport and Regional ...
PDF: 1352 KB - Bureau of Infrastructure, Transport and Regional ...
PDF: 1352 KB - Bureau of Infrastructure, Transport and Regional ...
- No tags were found...

Create successful ePaper yourself
Turn your PDF publications into a flip-book with our unique Google optimized e-Paper software.
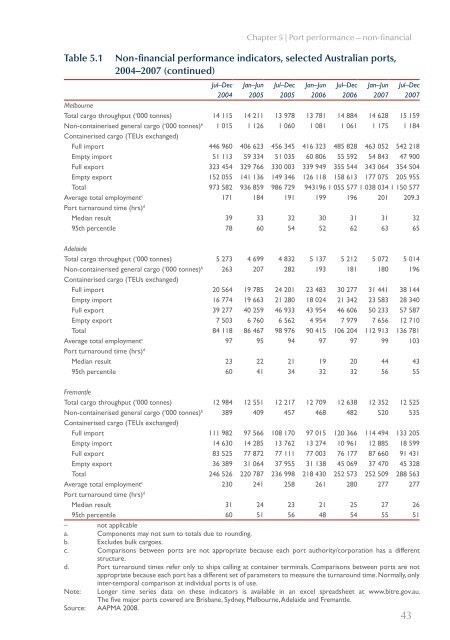
Table 5.1Chapter 5 | Port performance—non-financialNon-financial performance indicators, selected Australian ports,2004–2007 (continued)Jul–Dec Jan–Jun Jul–Dec Jan–Jun Jul–Dec Jan–Jun Jul–Dec2004 2005 2005 2006 2006 2007 2007MelbourneTotal cargo throughput (‘000 tonnes) 14 115 14 211 13 978 13 781 14 884 14 628 15 159Non-containerised general cargo (‘000 tonnes) b 1 015 1 126 1 060 1 081 1 061 1 175 1 184Containerised cargo (TEUs exchanged)Full import 446 960 406 623 456 345 416 323 485 828 463 052 542 218Empty import 51 113 59 334 51 035 60 806 55 592 54 843 47 900Full export 323 454 329 766 330 003 339 949 355 544 343 064 354 504Empty export 152 055 141 136 149 346 126 118 158 613 177 075 205 955Total 973 582 936 859 986 729 943196 1 055 577 1 038 034 1 150 577Average total employment c 171 184 191 199 196 201 209.3Port turnaround time (hrs) dMedian result 39 33 32 30 31 31 3295th percentile 78 60 54 52 62 63 65AdelaideTotal cargo throughput (‘000 tonnes) 5 273 4 699 4 832 5 137 5 212 5 072 5 014Non-containerised general cargo (‘000 tonnes) b 263 207 282 193 181 180 196Containerised cargo (TEUs exchanged)Full import 20 564 19 785 24 201 23 483 30 277 31 441 38 144Empty import 16 774 19 663 21 280 18 024 21 342 23 583 28 340Full export 39 277 40 259 46 933 43 954 46 606 50 233 57 587Empty export 7 503 6 760 6 562 4 954 7 979 7 656 12 710Total 84 118 86 467 98 976 90 415 106 204 112 913 136 781Average total employment c 97 95 94 97 97 99 103Port turnaround time (hrs) dMedian result 23 22 21 19 20 44 4395th percentile 60 41 34 32 32 56 55FremantleTotal cargo throughput (‘000 tonnes) 12 984 12 551 12 217 12 709 12 638 12 352 12 525Non-containerised general cargo (‘000 tonnes) b 389 409 457 468 482 520 535Containerised cargo (TEUs exchanged)Full import 111 982 97 566 108 170 97 015 120 366 114 494 133 205Empty import 14 630 14 285 13 762 13 274 10 961 12 885 18 599Full export 83 525 77 872 77 111 77 003 76 177 87 660 91 431Empty export 36 389 31 064 37 955 31 138 45 069 37 470 45 328Total 246 526 220 787 236 998 218 430 252 573 252 509 288 563Average total employment c 230 241 258 261 280 277 277Port turnaround time (hrs) dMedian result 31 24 23 21 25 27 2695th percentile 60 51 56 48 54 55 51– not applicablea. Components may not sum to totals due to rounding.b. Excludes bulk cargoes.c. Comparisons between ports are not appropriate because each port authority/corporation has a differentstructure.d. Port turnaround times refer only to ships calling at container terminals. Comparisons between ports are notappropriate because each port has a different set <strong>of</strong> parameters to measure the turnaround time. Normally, onlyinter-temporal comparison at individual ports is <strong>of</strong> use.Note: Longer time series data on these indicators is available in an excel spreadsheet at www.bitre.gov.au.The five major ports covered are Brisbane, Sydney, Melbourne, Adelaide <strong>and</strong> Fremantle.Source: AAPMA 2008.43


