

PDF: 1352 KB - Bureau of Infrastructure, Transport and Regional ...
PDF: 1352 KB - Bureau of Infrastructure, Transport and Regional ...
PDF: 1352 KB - Bureau of Infrastructure, Transport and Regional ...
- No tags were found...

You also want an ePaper? Increase the reach of your titles
YUMPU automatically turns print PDFs into web optimized ePapers that Google loves.
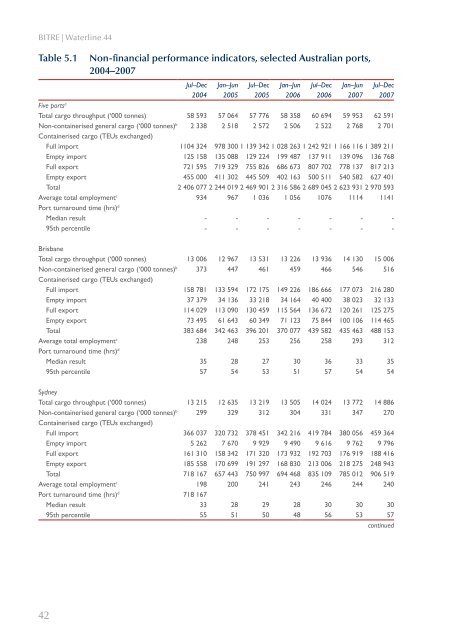
BITRE | Waterline 44Table 5.1Non-financial performance indicators, selected Australian ports,2004–2007Jul–Dec Jan–Jun Jul–Dec Jan–Jun Jul–Dec Jan–Jun Jul–Dec2004 2005 2005 2006 2006 2007 2007Five ports aTotal cargo throughput (‘000 tonnes) 58 593 57 064 57 776 58 358 60 694 59 953 62 591Non-containerised general cargo (‘000 tonnes) b 2 338 2 518 2 572 2 506 2 522 2 768 2 701Containerised cargo (TEUs exchanged)Full import 1104 324 978 300 1 139 342 1 028 263 1 242 921 1 166 116 1 389 211Empty import 125 158 135 088 129 224 199 487 137 911 139 096 136 768Full export 721 595 719 329 755 826 686 673 807 702 778 137 817 213Empty export 455 000 411 302 445 509 402 163 500 511 540 582 627 401Total 2 406 077 2 244 019 2 469 901 2 316 586 2 689 045 2 623 931 2 970 593Average total employment c 934 967 1 036 1 056 1076 1114 1141Port turnaround time (hrs) dMedian result - - - - - - -95th percentile - - - - - - -BrisbaneTotal cargo throughput (‘000 tonnes) 13 006 12 967 13 531 13 226 13 936 14 130 15 006Non-containerised general cargo (‘000 tonnes) b 373 447 461 459 466 546 516Containerised cargo (TEUs exchanged)Full import 158 781 133 594 172 175 149 226 186 666 177 073 216 280Empty import 37 379 34 136 33 218 34 164 40 400 38 023 32 133Full export 114 029 113 090 130 459 115 564 136 672 120 261 125 275Empty export 73 495 61 643 60 349 71 123 75 844 100 106 114 465Total 383 684 342 463 396 201 370 077 439 582 435 463 488 153Average total employment c 238 248 253 256 258 293 312Port turnaround time (hrs) dMedian result 35 28 27 30 36 33 3595th percentile 57 54 53 51 57 54 54SydneyTotal cargo throughput (‘000 tonnes) 13 215 12 635 13 219 13 505 14 024 13 772 14 886Non-containerised general cargo (‘000 tonnes) b 299 329 312 304 331 347 270Containerised cargo (TEUs exchanged)Full import 366 037 320 732 378 451 342 216 419 784 380 056 459 364Empty import 5 262 7 670 9 929 9 490 9 616 9 762 9 796Full export 161 310 158 342 171 320 173 932 192 703 176 919 188 416Empty export 185 558 170 699 191 297 168 830 213 006 218 275 248 943Total 718 167 657 443 750 997 694 468 835 109 785 012 906 519Average total employment c 198 200 241 243 246 244 240Port turnaround time (hrs) d 718 167Median result 33 28 29 28 30 30 3095th percentile 55 51 50 48 56 53 57continued42


