Assurance de qualité pour le cancer rectal – phase 2 ...
Assurance de qualité pour le cancer rectal – phase 2 ...
Assurance de qualité pour le cancer rectal – phase 2 ...

Create successful ePaper yourself
Turn your PDF publications into a flip-book with our unique Google optimized e-Paper software.
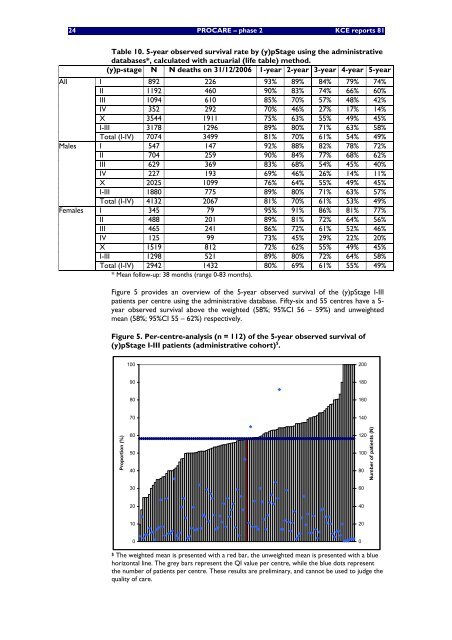
24 PROCARE <strong>–</strong> <strong>phase</strong> 2 KCE reports 81AllMa<strong>le</strong>sFema<strong>le</strong>sTab<strong>le</strong> 10. 5-year observed survival rate by (y)pStage using the administrativedatabases*, calculated with actuarial (life tab<strong>le</strong>) method.(y)p-stage N N <strong>de</strong>aths on 31/12/2006 1-year 2-year 3-year 4-year 5-yearI 892 226 93% 89% 84% 79% 74%II 1192 460 90% 83% 74% 66% 60%III 1094 610 85% 70% 57% 48% 42%IV 352 292 70% 46% 27% 17% 14%X 3544 1911 75% 63% 55% 49% 45%I-III 3178 1296 89% 80% 71% 63% 58%Total (I-IV) 7074 3499 81% 70% 61% 54% 49%I 547 147 92% 88% 82% 78% 72%II 704 259 90% 84% 77% 68% 62%III 629 369 83% 68% 54% 45% 40%IV 227 193 69% 46% 26% 14% 11%X 2025 1099 76% 64% 55% 49% 45%I-III 1880 775 89% 80% 71% 63% 57%Total (I-IV) 4132 2067 81% 70% 61% 53% 49%I 345 79 95% 91% 86% 81% 77%II 488 201 89% 81% 72% 64% 56%III 465 241 86% 72% 61% 52% 46%IV 125 99 73% 45% 29% 22% 20%X 1519 812 72% 62% 55% 49% 45%I-III 1298 521 89% 80% 72% 64% 58%Total (I-IV) 2942 1432 80% 69% 61% 55% 49%* Mean follow-up: 38 months (range 0-83 months).Figure 5 provi<strong>de</strong>s an overview of the 5-year observed survival of the (y)pStage I-IIIpatients per centre using the administrative database. Fifty-six and 55 centres have a 5-year observed survival above the weighted (58%; 95%CI 56 <strong>–</strong> 59%) and unweightedmean (58%; 95%CI 55 <strong>–</strong> 62%) respectively.Figure 5. Per-centre-analysis (n = 112) of the 5-year observed survival of(y)pStage I-III patients (administrative cohort) $ .100200901808016070140Proportion (%)605040301201008060Number of patients (N)2040102000$ The weighted mean is presented with a red bar, the unweighted mean is presented with a bluehorizontal line. The grey bars represent the QI value per centre, whi<strong>le</strong> the blue dots representthe number of patients per centre. These results are preliminary, and cannot be used to judge thequality of care.