Uptown Transportation Study - OKI
Uptown Transportation Study - OKI
Uptown Transportation Study - OKI

You also want an ePaper? Increase the reach of your titles
YUMPU automatically turns print PDFs into web optimized ePapers that Google loves.
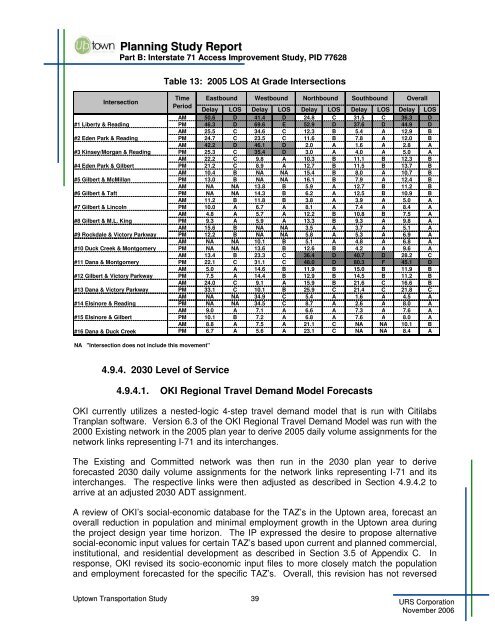
Planning <strong>Study</strong> ReportPart B: Interstate 71 Access Improvement <strong>Study</strong>, PID 77628Table 13: 2005 LOS At Grade IntersectionsIntersection#1 Liberty & Reading#2 Eden Park & Reading#3 Kinsey/Morgan & Reading#4 Eden Park & Gilbert#5 Gilbert & McMillan#6 Gilbert & Taft#7 Gilbert & Lincoln#8 Gilbert & M.L. King#9 Rockdale & Victory Parkway#10 Duck Creek & Montgomery#11 Dana & Montgomery#12 Gilbert & Victory Parkway#13 Dana & Victory Parkway#14 Elsinore & Reading#15 Elsinore & Gilbert#16 Dana & Duck CreekTime Eastbound Westbound Northbound Southbound OverallPeriodDelay LOS Delay LOS Delay LOS Delay LOS Delay LOSAM 50.6 D 41.4 D 24.8 C 31.5 C 36.3 DPM 46.3 D 69.6 E 52.9 D 37.6 D 44.9 DAM 25.5 C 34.6 C 12.3 B 5.4 A 12.9 BPM 24.7 C 23.5 C 11.6 B 7.8 A 12.0 BAM 42.2 D 46.1 D 2.0 A 1.6 A 2.8 APM 25.3 C 35.4 D 3.0 A 4.0 A 5.0 AAM 22.2 C 9.8 A 10.3 B 11.1 B 12.3 BPM 21.2 C 8.9 A 12.7 B 11.5 B 13.7 BAM 10.4 B NA NA 15.4 B 8.0 A 10.7 BPM 13.0 B NA NA 16.1 B 7.9 A 12.4 BAM NA NA 13.8 B 5.9 A 12.7 B 11.2 BPM NA NA 14.3 B 6.2 A 12.5 B 10.9 BAM 11.2 B 11.8 B 3.8 A 3.9 A 5.0 APM 10.0 A 6.7 A 8.1 A 7.4 A 8.4 AAM 4.8 A 5.7 A 12.2 B 10.8 B 7.5 APM 9.3 A 5.9 A 13.3 B 9.3 A 9.8 AAM 15.6 B NA NA 3.5 A 3.7 A 5.1 APM 12.2 B NA NA 5.8 A 5.3 A 6.9 AAM NA NA 10.1 B 5.1 A 4.8 A 6.8 APM NA NA 13.6 B 12.6 B 4.2 A 9.6 AAM 13.4 B 23.3 C 36.4 D 40.7 D 28.2 CPM 22.1 C 31.1 C 48.0 D 80.3 F 45.1 DAM 5.0 A 14.6 B 11.9 B 15.0 B 11.9 BPM 7.5 A 14.4 B 12.9 B 14.5 B 11.2 BAM 24.0 C 9.1 A 15.9 B 21.6 C 16.6 BPM 33.1 C 10.1 B 25.9 C 21.4 C 21.8 CAM NA NA 34.9 C 5.4 A 1.6 A 4.5 APM NA NA 34.5 C 8.7 A 2.6 A 8.0 AAM 9.0 A 7.1 A 6.6 A 7.3 A 7.6 APM 10.1 B 7.2 A 6.8 A 7.6 A 8.0 AAM 8.8 A 7.5 A 21.1 C NA NA 10.1 BPM 6.7 A 5.6 A 23.1 C NA NA 8.4 ANA "Intersection does not include this movement"4.9.4. 2030 Level of Service4.9.4.1. <strong>OKI</strong> Regional Travel Demand Model Forecasts<strong>OKI</strong> currently utilizes a nested-logic 4-step travel demand model that is run with CitilabsTranplan software. Version 6.3 of the <strong>OKI</strong> Regional Travel Demand Model was run with the2000 Existing network in the 2005 plan year to derive 2005 daily volume assignments for thenetwork links representing I-71 and its interchanges.The Existing and Committed network was then run in the 2030 plan year to deriveforecasted 2030 daily volume assignments for the network links representing I-71 and itsinterchanges. The respective links were then adjusted as described in Section 4.9.4.2 toarrive at an adjusted 2030 ADT assignment.A review of <strong>OKI</strong>’s social-economic database for the TAZ’s in the <strong>Uptown</strong> area, forecast anoverall reduction in population and minimal employment growth in the <strong>Uptown</strong> area duringthe project design year time horizon. The IP expressed the desire to propose alternativesocial-economic input values for certain TAZ’s based upon current and planned commercial,institutional, and residential development as described in Section 3.5 of Appendix C. Inresponse, <strong>OKI</strong> revised its socio-economic input files to more closely match the populationand employment forecasted for the specific TAZ’s. Overall, this revision has not reversed<strong>Uptown</strong> <strong>Transportation</strong> <strong>Study</strong> 39URS CorporationNovember 2006