Uptown Transportation Study - OKI
Uptown Transportation Study - OKI
Uptown Transportation Study - OKI

Create successful ePaper yourself
Turn your PDF publications into a flip-book with our unique Google optimized e-Paper software.
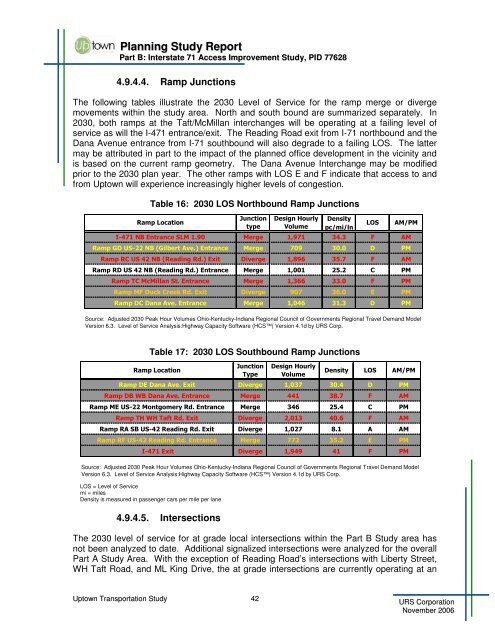
Planning <strong>Study</strong> ReportPart B: Interstate 71 Access Improvement <strong>Study</strong>, PID 776284.9.4.4. Ramp JunctionsThe following tables illustrate the 2030 Level of Service for the ramp merge or divergemovements within the study area. North and south bound are summarized separately. In2030, both ramps at the Taft/McMillan interchanges will be operating at a failing level ofservice as will the I-471 entrance/exit. The Reading Road exit from I-71 northbound and theDana Avenue entrance from I-71 southbound will also degrade to a failing LOS. The lattermay be attributed in part to the impact of the planned office development in the vicinity andis based on the current ramp geometry. The Dana Avenue Interchange may be modifiedprior to the 2030 plan year. The other ramps with LOS E and F indicate that access to andfrom <strong>Uptown</strong> will experience increasingly higher levels of congestion.Table 16: 2030 LOS Northbound Ramp Junctions/-->.-+-.-./+*/*#) 4 5( &( $)5$ 2 /6+#""4768 59 ( $5 + /:)"470059; + &'(! $%5 2 /+)"470059 & "%5" : /:5 &$!! $$5 2 /2+.,: ,05; + ( $!5 /+:+5 &)! $ 5$ + Source: Adjusted 2030 Peak Hour Volumes Ohio-Kentucky-Indiana Regional Council of Governments Regional Travel Demand ModelVersion 6.3. Level of Service Analysis:Highway Capacity Software (HCS) Version 4.1d by URS Corp.*Table 17: 2030 LOS Southbound Ramp Junctions/--/++5; + &$ $5) + /+4=4+5 )) $'5 2 /#""--/ 05 $)! "%5) : /=305; + "& $ )5! 2 /4#)"005; + &" '5 /2#)"005 " $%5" #) ; + &()( ) 2 Source: Adjusted 2030 Peak Hour Volumes Ohio-Kentucky-Indiana Regional Council of Governments Regional Travel Demand ModelVersion 6.3. Level of Service Analysis:Highway Capacity Software (HCS) Version 4.1d by URS Corp.LOS = Level of Servicemi = milesDensity is measured in passenger cars per mile per lane4.9.4.5. Intersections>.-+-.-./+*The 2030 level of service for at grade local intersections within the Part B <strong>Study</strong> area hasnot been analyzed to date. Additional signalized intersections were analyzed for the overallPart A <strong>Study</strong> Area. With the exception of Reading Road’s intersections with Liberty Street,WH Taft Road, and ML King Drive, the at grade intersections are currently operating at an<strong>Uptown</strong> <strong>Transportation</strong> <strong>Study</strong> 42URS CorporationNovember 2006