medical and biological sciences - Collegium Medicum - Uniwersytet ...
medical and biological sciences - Collegium Medicum - Uniwersytet ...
medical and biological sciences - Collegium Medicum - Uniwersytet ...
Create successful ePaper yourself
Turn your PDF publications into a flip-book with our unique Google optimized e-Paper software.
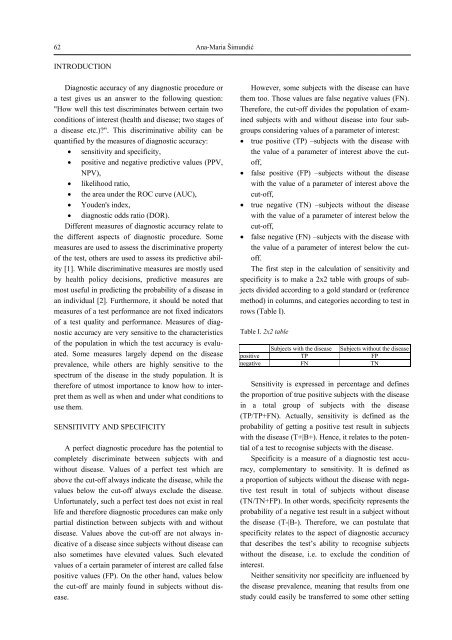
62Ana-Maria ŠimundićINTRODUCTIONDiagnostic accuracy of any diagnostic procedure ora test gives us an answer to the following question:"How well this test discriminates between certain twoconditions of interest (health <strong>and</strong> disease; two stages ofa disease etc.)?". This discriminative ability can bequantified by the measures of diagnostic accuracy:• sensitivity <strong>and</strong> specificity,• positive <strong>and</strong> negative predictive values (PPV,NPV),• likelihood ratio,• the area under the ROC curve (AUC),• Youden's index,• diagnostic odds ratio (DOR).Different measures of diagnostic accuracy relate tothe different aspects of diagnostic procedure. Somemeasures are used to assess the discriminative propertyof the test, others are used to assess its predictive ability[1]. While discriminative measures are mostly usedby health policy decisions, predictive measures aremost useful in predicting the probability of a disease inan individual [2]. Furthermore, it should be noted thatmeasures of a test performance are not fixed indicatorsof a test quality <strong>and</strong> performance. Measures of diagnosticaccuracy are very sensitive to the characteristicsof the population in which the test accuracy is evaluated.Some measures largely depend on the diseaseprevalence, while others are highly sensitive to thespectrum of the disease in the study population. It istherefore of utmost importance to know how to interpretthem as well as when <strong>and</strong> under what conditions touse them.SENSITIVITY AND SPECIFICITYA perfect diagnostic procedure has the potential tocompletely discriminate between subjects with <strong>and</strong>without disease. Values of a perfect test which areabove the cut-off always indicate the disease, while thevalues below the cut-off always exclude the disease.Unfortunately, such a perfect test does not exist in reallife <strong>and</strong> therefore diagnostic procedures can make onlypartial distinction between subjects with <strong>and</strong> withoutdisease. Values above the cut-off are not always indicativeof a disease since subjects without disease canalso sometimes have elevated values. Such elevatedvalues of a certain parameter of interest are called falsepositive values (FP). On the other h<strong>and</strong>, values belowthe cut-off are mainly found in subjects without disease.However, some subjects with the disease can havethem too. Those values are false negative values (FN).Therefore, the cut-off divides the population of examinedsubjects with <strong>and</strong> without disease into four subgroupsconsidering values of a parameter of interest:• true positive (TP) –subjects with the disease withthe value of a parameter of interest above the cutoff,• false positive (FP) –subjects without the diseasewith the value of a parameter of interest above thecut-off,• true negative (TN) –subjects without the diseasewith the value of a parameter of interest below thecut-off,• false negative (FN) –subjects with the disease withthe value of a parameter of interest below the cutoff.The first step in the calculation of sensitivity <strong>and</strong>specificity is to make a 2x2 table with groups of subjectsdivided according to a gold st<strong>and</strong>ard or (referencemethod) in columns, <strong>and</strong> categories according to test inrows (Table I).Table I. 2x2 tableSubjects with the disease Subjects without the diseasepositive TP FPnegative FN TNSensitivity is expressed in percentage <strong>and</strong> definesthe proportion of true positive subjects with the diseasein a total group of subjects with the disease(TP/TP+FN). Actually, sensitivity is defined as theprobability of getting a positive test result in subjectswith the disease (T+|B+). Hence, it relates to the potentialof a test to recognise subjects with the disease.Specificity is a measure of a diagnostic test accuracy,complementary to sensitivity. It is defined asa proportion of subjects without the disease with negativetest result in total of subjects without disease(TN/TN+FP). In other words, specificity represents theprobability of a negative test result in a subject withoutthe disease (T-|B-). Therefore, we can postulate thatspecificity relates to the aspect of diagnostic accuracythat describes the test’s ability to recognise subjectswithout the disease, i.e. to exclude the condition ofinterest.Neither sensitivity nor specificity are influenced bythe disease prevalence, meaning that results from onestudy could easily be transferred to some other setting


