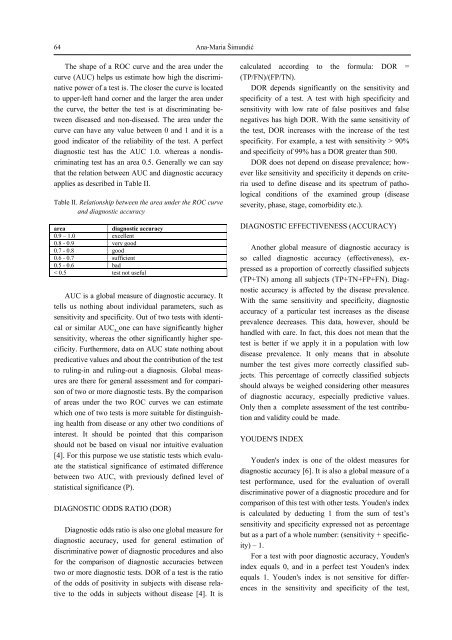
64Ana-Maria ŠimundićThe shape of a ROC curve <strong>and</strong> the area under thecurve (AUC) helps us estimate how high the discriminativepower of a test is. The closer the curve is locatedto upper-left h<strong>and</strong> corner <strong>and</strong> the larger the area underthe curve, the better the test is at discriminating betweendiseased <strong>and</strong> non-diseased. The area under thecurve can have any value between 0 <strong>and</strong> 1 <strong>and</strong> it is agood indicator of the reliability of the test. A perfectdiagnostic test has the AUC 1.0. whereas a nondiscriminatingtest has an area 0.5. Generally we can saythat the relation between AUC <strong>and</strong> diagnostic accuracyapplies as described in Table II.Table II. Relationship between the area under the ROC curve<strong>and</strong> diagnostic accuracyareadiagnostic accuracy0.9 – 1.0 excellent0.8 - 0.9 very good0.7 - 0.8 good0.6 - 0.7 sufficient0.5 - 0.6 bad< 0.5 test not usefulAUC is a global measure of diagnostic accuracy. Ittells us nothing about individual parameters, such assensitivity <strong>and</strong> specificity. Out of two tests with identicalor similar AUC, one can have significantly highersensitivity, whereas the other significantly higher specificity.Furthermore, data on AUC state nothing aboutpredicative values <strong>and</strong> about the contribution of the testto ruling-in <strong>and</strong> ruling-out a diagnosis. Global measuresare there for general assessment <strong>and</strong> for comparisonof two or more diagnostic tests. By the comparisonof areas under the two ROC curves we can estimatewhich one of two tests is more suitable for distinguishinghealth from disease or any other two conditions ofinterest. It should be pointed that this comparisonshould not be based on visual nor intuitive evaluation[4]. For this purpose we use statistic tests which evaluatethe statistical significance of estimated differencebetween two AUC, with previously defined level ofstatistical significance (P).DIAGNOSTIC ODDS RATIO (DOR)Diagnostic odds ratio is also one global measure fordiagnostic accuracy, used for general estimation ofdiscriminative power of diagnostic procedures <strong>and</strong> alsofor the comparison of diagnostic accuracies betweentwo or more diagnostic tests. DOR of a test is the ratioof the odds of positivity in subjects with disease relativeto the odds in subjects without disease [4]. It iscalculated according to the formula: DOR =(TP/FN)/(FP/TN).DOR depends significantly on the sensitivity <strong>and</strong>specificity of a test. A test with high specificity <strong>and</strong>sensitivity with low rate of false positives <strong>and</strong> falsenegatives has high DOR. With the same sensitivity ofthe test, DOR increases with the increase of the testspecificity. For example, a test with sensitivity > 90%<strong>and</strong> specificity of 99% has a DOR greater than 500.DOR does not depend on disease prevalence; howeverlike sensitivity <strong>and</strong> specificity it depends on criteriaused to define disease <strong>and</strong> its spectrum of pathologicalconditions of the examined group (diseaseseverity, phase, stage, comorbidity etc.).DIAGNOSTIC EFFECTIVENESS (ACCURACY)Another global measure of diagnostic accuracy isso called diagnostic accuracy (effectiveness), expressedas a proportion of correctly classified subjects(TP+TN) among all subjects (TP+TN+FP+FN). Diagnosticaccuracy is affected by the disease prevalence.With the same sensitivity <strong>and</strong> specificity, diagnosticaccuracy of a particular test increases as the diseaseprevalence decreases. This data, however, should beh<strong>and</strong>led with care. In fact, this does not mean that thetest is better if we apply it in a population with lowdisease prevalence. It only means that in absolutenumber the test gives more correctly classified subjects.This percentage of correctly classified subjectsshould always be weighed considering other measuresof diagnostic accuracy, especially predictive values.Only then a complete assessment of the test contribution<strong>and</strong> validity could be made.YOUDEN'S INDEXYouden's index is one of the oldest measures fordiagnostic accuracy [6]. It is also a global measure of atest performance, used for the evaluation of overalldiscriminative power of a diagnostic procedure <strong>and</strong> forcomparison of this test with other tests. Youden's indexis calculated by deducting 1 from the sum of test’ssensitivity <strong>and</strong> specificity expressed not as percentagebut as a part of a whole number: (sensitivity + specificity)– 1.For a test with poor diagnostic accuracy, Youden'sindex equals 0, <strong>and</strong> in a perfect test Youden's indexequals 1. Youden's index is not sensitive for differencesin the sensitivity <strong>and</strong> specificity of the test,
Measures of diagnostic accuracy: basic definitions 65which is its main disadvantage. Namely, a test withsensitivity 0,9 <strong>and</strong> specificity 0,4 has the sameYouden's index (0,3) as a test with sensitivity 0,6 <strong>and</strong>specificity 0,7. It is absolutely clear that those tests arenot of comparable diagnostic accuracy. If one is toassess the discriminative power of a test solely basedon Youden's index it could be mistakenly concludedthat these two tests are equally effective.Youden’s index is not affected by the diseaseprevalence, but it is affected by the spectrum of thedisease, as are also sensitivity specificity, likelihoodratios <strong>and</strong> DOR.DESIGN OF DIAGNOSTIC ACCURACY STUDIESMeasures of diagnostic accuracy are extremely sensitiveto the design of the study. Studies suffering fromsome major methodological shortcomings can severelyover- or under-estimate the indicators of test performanceas well as they can severely limit the possibleapplicability of the results of the study. The effect ofthe design of the study on the bias <strong>and</strong> variation in theestimates of diagnostic accuracy can be quantified [7].STARD initiative published in 2003 was a very importantstep toward the improvement of the quality ofreporting of studies of diagnostic accuracy [8, 9]. Accordingto some authors, the quality of reporting ofdiagnostic accuracy studies did not significantly improveafter the publication of the STARD statement[10, 11], whereas some others hold that the overallquality of reporting has at least slightly improved [12],but there is still some room for potential improvement[13, 14].Editors of scientific journals are encouraged to includethe STARD statement into the Journal Instructionsto authors <strong>and</strong> to oblige their authors to use thechecklist when reporting their studies on diagnosticaccuracy. This way the quality of reporting could besignificantly improved, providing the best possibleevidence for health care providers, clinicians <strong>and</strong> laboratoryprofessionals; to the best for the patient care.REFERENCES1. Irwig L, Bossuyt P, Glasziou P, Gatsonis C, Lijmer J.Designing studies to ensure that estimates of test accuracyare transferable. BMJ. 2002;324(7338):669-71.2. Raslich MA. Markert RJ, Stutes SA. Selecting <strong>and</strong> interpretingdiagnostic tests. Biochemia Medica2007;17(2):139-270.3. Deeks JJ, Altman DG. Diagnostic tests 4: likelihoodratios. BMJ 2004;17;329(7458):168-9.4. Obuchowski NA, Lieber ML, Wians FH Jr. ROC curvesin clinical chemistry: uses, misuses, <strong>and</strong> possible solutions.Clin Chem. 2004;50(7):1118-25.5. Glas AS, Lijmer JG, Prins MH, Bonsel GJ, Bossuyt PM.The diagnostic odds ratio: a single indicator of test performance.J. Clin Epidemiol. 2003;56(11):1129-35.6. Youden WJ. Index for rating diagnostic tests. Cancer.1950;3:32-35.7. Rutjes AW, Reitsma JB, Di Nisio M, Smidt N, van RijnJC, Bossuyt PM. Evidence of bias <strong>and</strong> variation in diagnosticaccuracy studies. CMAJ. 2006;14;174(4):469-76.8. Bossuyt PM, Reitsma JB, Bruns DE, Gatsonis CA,Glasziou PP, Irwig LM, et al. Towards complete <strong>and</strong> accuratereporting of studies of diagnostic accuracy: theSTARD initiative. Clin Chem 2003;49:1-6.9. Bossuyt PM, Reitsma JB, Bruns DE, Gatsonis CA,Glasziou PP, Irwig LM, et al. The STARD statement forreporting studies of diagnostic accuracy: explanation <strong>and</strong>elaboration. Clin Chem 2003;49:7-18.10. Wilczynski NL. Quality of reporting of diagnostic accuracystudies: no change since STARD statement publication--before-<strong>and</strong>-afterstudy. Radiology. 2008; 248(3):817-23.11. Bossuyt PM. STARD statement: still room for improvementin the reporting of diagnostic accuracy studies. Radiology2008;248(3):713-4.12. Smidt N, Rutjes AWS, Van der Windt DAWM, OsteloRWJG, Bossuyt PM, Reitsma JB, et al. The quality of diagnosticaccuracy studies since the STARD statement:has it improved?. Neurology 2006;67:792-797.13. Bossuyt PM. Clinical evaluation of <strong>medical</strong> tests: still along road to go. Biochemia Medica 2006;16(2)89–228.14. Bossuyt PM. The quality of reporting in diagnostic testresearch: getting better, still not optimal. Clin Chem.2004;50(3):465-6.Corresponding author:e-mail: am.simundic@gmail.comReceived: 9.12.2008Accepted for publication: 13.01.2009
- Page 8:
8Wojciech J. Baranowskirating) move
- Page 13 and 14: The benefits resulting from introdu
- Page 15 and 16: The benefits resulting from introdu
- Page 17 and 18: Medical and Biological Sciences, 20
- Page 19 and 20: The history and the present of hern
- Page 21 and 22: The history and the present of hern
- Page 23: The history and the present of hern
- Page 26: 26Anna Budzyńska et al.Gram-dodatn
- Page 32 and 33: 32Piotr Kamiński et al.Streszczeni
- Page 34 and 35: 34Piotr Kamiński et al.both in Pom
- Page 36 and 37: 36Piotr Kamiński et al.hemoglobin
- Page 39 and 40: Medical and Biological Sciences, 20
- Page 41 and 42: Impact of mandatory vaccination pro
- Page 43 and 44: Medical and Biological Sciences, 20
- Page 45 and 46: Bone turnover during pregnancy 45ra
- Page 47: Bone turnover during pregnancy 47pl
- Page 50 and 51: 50Jan Styczyński, Anna Jaworska(p
- Page 52 and 53: 52Jan Styczyński, Anna JaworskaRES
- Page 55 and 56: Medical and Biological Sciences, 20
- Page 57 and 58: Analysis of immunophenotype at seco
- Page 59: Analysis of immunophenotype at seco
- Page 62 and 63: 62Ana-Maria ŠimundićINTRODUCTIOND
- Page 67 and 68: Medical and Biological Sciences, 20
- Page 69 and 70: Quantitative anatomy of the aortic
- Page 71 and 72: Quantitative anatomy of the aortic
- Page 73 and 74: Medical and Biological Sciences, 20
- Page 75 and 76: Volumetric growth of various aortic
- Page 77 and 78: Volumetric growth of various aortic
- Page 79 and 80: Medical and Biological Sciences, 20
- Page 81 and 82: Effect of Low Level Laser Therapy a
- Page 83 and 84: Effect of Low Level Laser Therapy a
- Page 85 and 86: Medical and Biological Sciences, 20
- Page 87 and 88: Body weight support during treadmil
- Page 89 and 90: Body weight support during treadmil
- Page 91 and 92: Medical and Biological Sciences, 20


