Evaluation of Greenhouse Gas Emissions from Septic ... - Geoflow
Evaluation of Greenhouse Gas Emissions from Septic ... - Geoflow
Evaluation of Greenhouse Gas Emissions from Septic ... - Geoflow

Create successful ePaper yourself
Turn your PDF publications into a flip-book with our unique Google optimized e-Paper software.
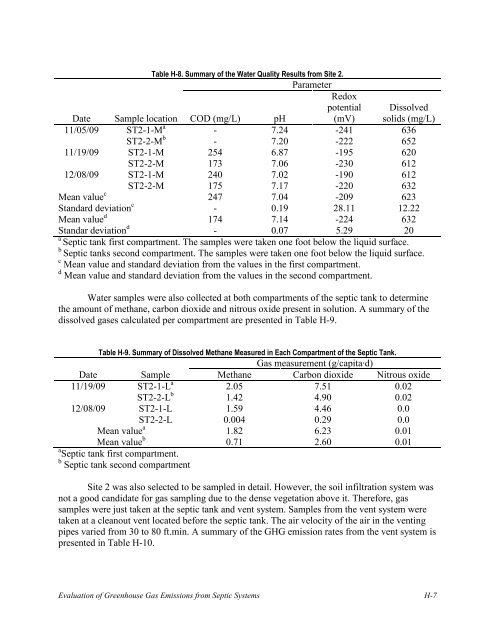
Table H-8. Summary <strong>of</strong> the Water Quality Results <strong>from</strong> Site 2.ParameterRedoxDate Sample location COD (mg/L) pHpotential(mV)Dissolvedsolids (mg/L)11/05/09 ST2-1-M a - 7.24 -241 636ST2-2-M b - 7.20 -222 65211/19/09 ST2-1-M 254 6.87 -195 620ST2-2-M 173 7.06 -230 61212/08/09 ST2-1-M 240 7.02 -190 612ST2-2-M 175 7.17 -220 632Mean value c 247 7.04 -209 623Standard deviation c - 0.19 28.11 12.22Mean value d 174 7.14 -224 632Standar deviation d - 0.07 5.29 20a<strong>Septic</strong> tank first compartment. The samples were taken one foot below the liquid surface.b<strong>Septic</strong> tanks second compartment. The samples were taken one foot below the liquid surface.c Mean value and standard deviation <strong>from</strong> the values in the first compartment.d Mean value and standard deviation <strong>from</strong> the values in the second compartment.Water samples were also collected at both compartments <strong>of</strong> the septic tank to determinethe amount <strong>of</strong> methane, carbon dioxide and nitrous oxide present in solution. A summary <strong>of</strong> thedissolved gases calculated per compartment are presented in Table H-9.Table H-9. Summary <strong>of</strong> Dissolved Methane Measured in Each Compartment <strong>of</strong> the <strong>Septic</strong> Tank.<strong>Gas</strong> measurement (g/capita·d)Date Sample Methane Carbon dioxide Nitrous oxide11/19/09 ST2-1-L a 2.05 7.51 0.02ST2-2-L b 1.42 4.90 0.0212/08/09 ST2-1-L 1.59 4.46 0.0ST2-2-L 0.004 0.29 0.0Mean value a 1.82 6.23 0.01Mean value b 0.71 2.60 0.01a <strong>Septic</strong> tank first compartment.<strong>Septic</strong> tank second compartmentSite 2 was also selected to be sampled in detail. However, the soil infiltration system wasnot a good candidate for gas sampling due to the dense vegetation above it. Therefore, gassamples were just taken at the septic tank and vent system. Samples <strong>from</strong> the vent system weretaken at a cleanout vent located before the septic tank. The air velocity <strong>of</strong> the air in the ventingpipes varied <strong>from</strong> 30 to 80 ft.min. A summary <strong>of</strong> the GHG emission rates <strong>from</strong> the vent system ispresented in Table H-10.<strong>Evaluation</strong> <strong>of</strong> <strong>Greenhouse</strong> <strong>Gas</strong> <strong>Emissions</strong> <strong>from</strong> <strong>Septic</strong> Systems H-7