Evaluation of Greenhouse Gas Emissions from Septic ... - Geoflow
Evaluation of Greenhouse Gas Emissions from Septic ... - Geoflow
Evaluation of Greenhouse Gas Emissions from Septic ... - Geoflow
You also want an ePaper? Increase the reach of your titles
YUMPU automatically turns print PDFs into web optimized ePapers that Google loves.
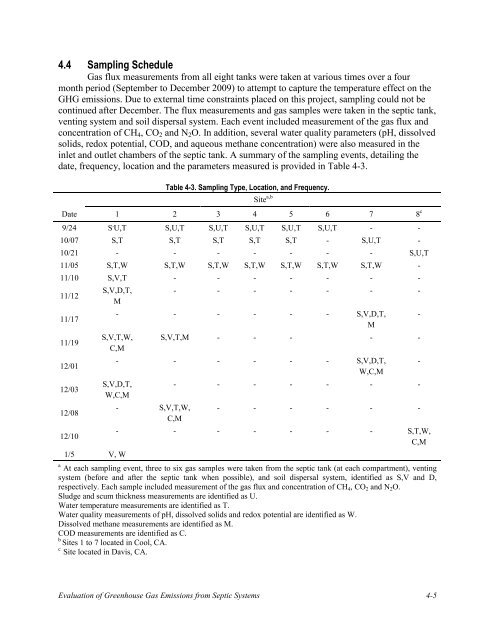
4.4 Sampling Schedule<strong>Gas</strong> flux measurements <strong>from</strong> all eight tanks were taken at various times over a fourmonth period (September to December 2009) to attempt to capture the temperature effect on theGHG emissions. Due to external time constraints placed on this project, sampling could not becontinued after December. The flux measurements and gas samples were taken in the septic tank,venting system and soil dispersal system. Each event included measurement <strong>of</strong> the gas flux andconcentration <strong>of</strong> CH 4 , CO 2 and N 2 O. In addition, several water quality parameters (pH, dissolvedsolids, redox potential, COD, and aqueous methane concentration) were also measured in theinlet and outlet chambers <strong>of</strong> the septic tank. A summary <strong>of</strong> the sampling events, detailing thedate, frequency, location and the parameters measured is provided in Table 4-3.Table 4-3. Sampling Type, Location, and Frequency.Site a,bDate 1 2 3 4 5 6 7 8 c9/24 S , U,T S,U,T S,U,T S,U,T S,U,T S,U,T - -10/07 S,T S,T S,T S,T S,T - S,U,T -10/21 - - - - - - - S,U,T11/05 S,T,W S,T,W S,T,W S,T,W S,T,W S,T,W S,T,W -11/10 S,V,T - - - - - - -11/12S,V,D,T,- - - - - - -M11/17- - - - - - S,V,D,T, -M11/19S,V,T,W, S,V,T,M - - - - -C,M12/01- - - - - - S,V,D,T, -W,C,M12/03S,V,D,T,- - - - - - -W,C,M12/08- S,V,T,W, - - - - - -C,M12/10- - - - - - - S,T,W,C,M1/5 V, Wa At each sampling event, three to six gas samples were taken <strong>from</strong> the septic tank (at each compartment), ventingsystem (before and after the septic tank when possible), and soil dispersal system, identified as S,V and D,respectively. Each sample included measurement <strong>of</strong> the gas flux and concentration <strong>of</strong> CH 4 , CO 2 and N 2 O.Sludge and scum thickness measurements are identified as U.Water temperature measurements are identified as T.Water quality measurements <strong>of</strong> pH, dissolved solids and redox potential are identified as W.Dissolved methane measurements are identified as M.COD measurements are identified as C.bSites 1 to 7 located in Cool, CA.cSite located in Davis, CA.<strong>Evaluation</strong> <strong>of</strong> <strong>Greenhouse</strong> <strong>Gas</strong> <strong>Emissions</strong> <strong>from</strong> <strong>Septic</strong> Systems 4-5


