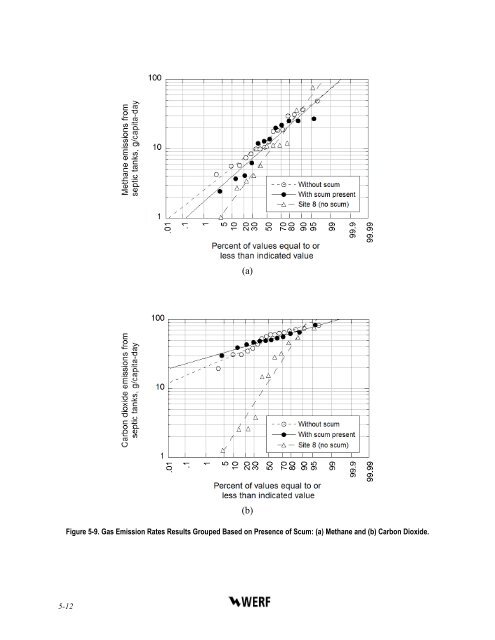
5.3 Sources <strong>of</strong> Variability in <strong>Gas</strong> <strong>Emissions</strong>A number <strong>of</strong> factors contributed to the wide variability in the gas emission measurementsrecorded for the septic systems included in this study. The influence <strong>of</strong> factors such as waterhardness, presence <strong>of</strong> scum layer, pumping intervals, turnover events, presence <strong>of</strong> invertebrates,temperature, and the septic tank effluent filter are discussed in this section.5.3.1 Water Hardness Influence on Carbon Dioxide <strong>Emissions</strong>As mentioned previously, the water supply for the Auburn Lakes Trails (ALT)development, encompassing Sites 1 through 7, originates in the Sierra and flows into theStrumpy Meadows Reservoir; it has an average hardness content <strong>of</strong> 9 mg/L as CaCO 3 (GDPUD,2009) which indicates a s<strong>of</strong>t water supply. In contrast, the water that serves the tank located inDavis is pumped out <strong>from</strong> a groundwater well and has an average hardness <strong>of</strong> 212 mg/L asCaCO 3 (CDPW, 2009) indicating a hard water supply.A comparison <strong>of</strong> the carbon dioxide emission rates data between the sites located in ALTand the tank for Site 8 (Figure 5-2) indicates different distributions. It is hypothesized that thehardness content <strong>of</strong> the water supply in each area may be a reason for this differing behavior. Inaddition to the difference in source water, Site 8 had other distinguishing characteristics thatpotentially impacted emissions. Unique aspects at Site 8 include the diversion <strong>of</strong> laundry waterto a gray water system, a higher number <strong>of</strong> occupants per tank volume, and the vegetarian diet <strong>of</strong>the house occupants. It is conceivable that these aspects may also influence the overall anaerobicand facultative processes occurring in the tank and hence the carbon dioxide emission rates.5.3.2 Influence <strong>of</strong> Scum Layer on <strong>Gas</strong> <strong>Emissions</strong>Two different groups <strong>of</strong> sites were compared to determine the influence <strong>of</strong> the scum layerin the overall emissions <strong>from</strong> the septic tank. The first group was composed <strong>of</strong> the tanks <strong>from</strong>Sites 2, 3, and 7 that share as a common characteristic a thick scum layer varying <strong>from</strong> 3 to 5inch in depth, with similar appearance, black color, humus like texture and usually covered theliquid surface <strong>of</strong> the septic tank. The septic tanks at Sites 1, 5, and 6 formed the second group;these tanks were characterized by patchy, light scum (less than 1"), with a light brownish color.As shown on Figure 5-9, the average methane and carbon dioxide emission rates <strong>from</strong> the sitesthat have a thick scum layer are similar to the sites without scum and the slopes are also similar.The data <strong>from</strong> the septic tank at Site 8 (light scum, hard water) was plotted separately forcomparison.5.3.3 <strong>Emissions</strong> <strong>from</strong> Recently Cleaned TankThe septic tank located at Site 4 was not a typical septic tank. It did not have any scumformation; the sludge was less than 14" in depth, with a light brown coloration and a particularpine odor was emitted when the tank lids were opened. The tank was last pumped out in late July<strong>of</strong> 2009 (measurements took place during September 2009). The methane and carbon dioxide gasemission rates <strong>from</strong> the tank at Site 4 in g/capita·d, averaged 0.2 and 3.2, respectively. Nitrousoxide emission rates were negligible. From the results <strong>of</strong> the overall GHG emission rate and thecharacteristics <strong>of</strong> the tank discussed above, it can be assumed that methanogenesis was notoccurring in this tank, which is consistent with results reported by Weibel et al. (1955) forrecently pumped septic tanks, which had a lag phase in the gas production.<strong>Evaluation</strong> <strong>of</strong> <strong>Greenhouse</strong> <strong>Gas</strong> <strong>Emissions</strong> <strong>from</strong> <strong>Septic</strong> Systems 5-11
(a)(b)Figure 5-9. <strong>Gas</strong> Emission Rates Results Grouped Based on Presence <strong>of</strong> Scum: (a) Methane and (b) Carbon Dioxide.5-12
- Page 1 and 2:
D e c e n t r a l i z e dEvaluation
- Page 3 and 4:
The Water Environment Research Foun
- Page 5 and 6:
ABSTRACT AND BENEFITSAbstract:This
- Page 7 and 8:
3.1.2 Flux Chamber Inserts for Sept
- Page 9 and 10:
LIST OF TABLESES-1 Summary of Metha
- Page 11 and 12:
3-7 Use of Flux Chamber in the Soil
- Page 13 and 14:
Evaluation of Greenhouse Gas Emissi
- Page 15 and 16:
tank is converted anaerobically. Fu
- Page 17 and 18:
RecommendationsBased on the finding
- Page 19 and 20:
♦♦Collection of gas samples fro
- Page 21 and 22:
include Imhoff tanks, anaerobic baf
- Page 23 and 24: 2.2 Septic Tank CharacteristicsSept
- Page 25 and 26: 2.2.3 General Conversion Processes
- Page 27 and 28: increase in thickness with daily so
- Page 29 and 30: environmental damage and/or health
- Page 31 and 32: Figure 2-6. The Intermediate Steps
- Page 33 and 34: In anaerobic reactors, the alkalini
- Page 35 and 36: epresentative concentrations. Inhib
- Page 37 and 38: 2.4 Gas Emissions from Septic Syste
- Page 39 and 40: Figure 2-9. Flux Chamber Designed b
- Page 41 and 42: due to settling and anaerobic diges
- Page 43 and 44: total methane production value of 1
- Page 45 and 46: 2-26
- Page 47 and 48: The main body of the flux chamber w
- Page 49 and 50: 3.1.3 Flux Chamber Design for Use i
- Page 51 and 52: 3.2 Sampling ProtocolsThe three pri
- Page 53 and 54: 3.2.3 Sampling Method for Vent Syst
- Page 55 and 56: 3.3 Gas AnalysisThe gas samples wer
- Page 57 and 58: ppm (raw data from laboratory) were
- Page 59 and 60: gal. Sites 5, 6, and 7 were the onl
- Page 61 and 62: Table 4-2. Continued from previous
- Page 63 and 64: Three of the septic tanks that appe
- Page 65 and 66: steeper than that for the rest of t
- Page 67 and 68: espectively, and for methane were 4
- Page 69 and 70: oth before and after the septic tan
- Page 71 and 72: noted that in this approach it is a
- Page 73: The septic tank effluent CO 2 equiv
- Page 77 and 78: Figure 5-11. Emission Rates from Si
- Page 79 and 80: (a)(b)Figure 5-13. Views of the Eff
- Page 81 and 82: It is important to note that the U.
- Page 83 and 84: ♦ Methane generated during the an
- Page 85 and 86: A-2
- Page 87 and 88: B. Based on COD Loading1. Determine
- Page 89 and 90: C-2
- Page 91 and 92: 2. First row of Table 23 from Sasse
- Page 93 and 94: Biogas production = (COD inflow - C
- Page 95 and 96: E-2
- Page 97 and 98: SAMPLING FROM SOIL SURFACEDate:Hour
- Page 99 and 100: F-4
- Page 101 and 102: G-2
- Page 103 and 104: DateSamplelocationGas measurement (
- Page 105 and 106: After the initial inspections, Site
- Page 107 and 108: H-2 Site 2The scum layer in the fir
- Page 109 and 110: Table H-10. GHG Emission Rates From
- Page 111 and 112: Table H-14. Summary of the Water Qu
- Page 113 and 114: Table H-18. Summary of the Water Qu
- Page 115 and 116: Table H-22. GHG Emission Rates from
- Page 117 and 118: Sample Gas measurement (g/capita·d
- Page 119 and 120: H-9 Summary of ResultsA summary of
- Page 121 and 122: I-2
- Page 123 and 124: Treatment in Decentralized Wastewat
- Page 125 and 126:
Philip, H., S. Maunoir, A. Rambaud,
- Page 127 and 128:
Winfrey, M.R. and J.G. Zeikus (1977
- Page 129 and 130:
Fort Worth, City ofHouston, City of
- Page 132:
W E R F P r o d u c t O r d e r F o