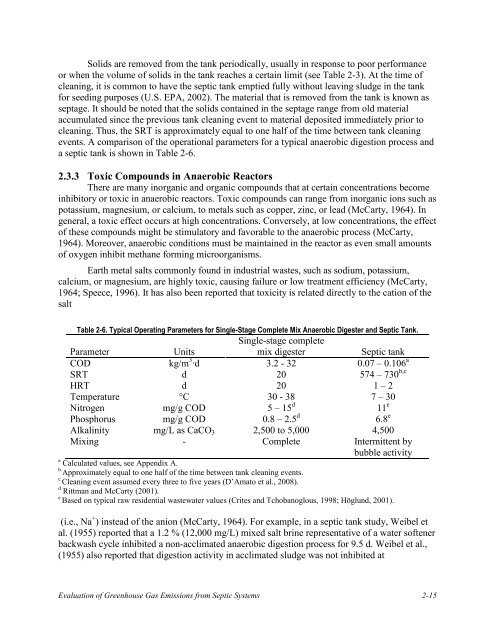
Solids are removed <strong>from</strong> the tank periodically, usually in response to poor performanceor when the volume <strong>of</strong> solids in the tank reaches a certain limit (see Table 2-3). At the time <strong>of</strong>cleaning, it is common to have the septic tank emptied fully without leaving sludge in the tankfor seeding purposes (U.S. EPA, 2002). The material that is removed <strong>from</strong> the tank is known asseptage. It should be noted that the solids contained in the septage range <strong>from</strong> old materialaccumulated since the previous tank cleaning event to material deposited immediately prior tocleaning. Thus, the SRT is approximately equal to one half <strong>of</strong> the time between tank cleaningevents. A comparison <strong>of</strong> the operational parameters for a typical anaerobic digestion process anda septic tank is shown in Table 2-6.2.3.3 Toxic Compounds in Anaerobic ReactorsThere are many inorganic and organic compounds that at certain concentrations becomeinhibitory or toxic in anaerobic reactors. Toxic compounds can range <strong>from</strong> inorganic ions such aspotassium, magnesium, or calcium, to metals such as copper, zinc, or lead (McCarty, 1964). Ingeneral, a toxic effect occurs at high concentrations. Conversely, at low concentrations, the effect<strong>of</strong> these compounds might be stimulatory and favorable to the anaerobic process (McCarty,1964). Moreover, anaerobic conditions must be maintained in the reactor as even small amounts<strong>of</strong> oxygen inhibit methane forming microorganisms.Earth metal salts commonly found in industrial wastes, such as sodium, potassium,calcium, or magnesium, are highly toxic, causing failure or low treatment efficiency (McCarty,1964; Speece, 1996). It has also been reported that toxicity is related directly to the cation <strong>of</strong> thesaltTable 2-6. Typical Operating Parameters for Single-Stage Complete Mix Anaerobic Digester and <strong>Septic</strong> Tank.ParameterUnitsSingle-stage completemix digester<strong>Septic</strong> tankCOD kg/m 3·d 3.2 - 32 0.07 – 0.106 aSRT d 20 574 – 730 b,cHRT d 20 1 – 2Temperature °C 30 - 38 7 – 30Nitrogen mg/g COD 5 – 15 d 11 ePhosphorus mg/g COD 0.8 – 2.5 d 6.8 eAlkalinity mg/L as CaCO 3 2,500 to 5,000 4,500Mixing - Complete Intermittent bybubble activitya Calculated values, see Appendix A.bApproximately equal to one half <strong>of</strong> the time between tank cleaning events.cCleaning event assumed every three to five years (D’Amato et al., 2008).d Rittman and McCarty (2001).eBased on typical raw residential wastewater values (Crites and Tchobanoglous, 1998; Höglund, 2001).(i.e., Na + ) instead <strong>of</strong> the anion (McCarty, 1964). For example, in a septic tank study, Weibel etal. (1955) reported that a 1.2 % (12,000 mg/L) mixed salt brine representative <strong>of</strong> a water s<strong>of</strong>tenerbackwash cycle inhibited a non-acclimated anaerobic digestion process for 9.5 d. Weibel et al.,(1955) also reported that digestion activity in acclimated sludge was not inhibited at<strong>Evaluation</strong> <strong>of</strong> <strong>Greenhouse</strong> <strong>Gas</strong> <strong>Emissions</strong> <strong>from</strong> <strong>Septic</strong> Systems 2-15
epresentative concentrations. Inhibitory as well as stimulatory concentrations <strong>of</strong> selectedcompounds are shown in Table 2-7.Table 2-7. Cation Concentrations that Cause Inhibitory and Stimulatory Effects on Anaerobic Processes a .Concentration, mg/LCation Strong inhibition b Moderate inhibition c StimulatoryNa + 8,000 3,500 - 5,500 100-200K + 12,000 2,500 - 4,500 200-400Ca 2+ 8,000 2,500 - 4,500 100-200Mg 2+ 3,000 1,000 - 1,500 75-150aAdapted <strong>from</strong> McCarty, 1964.bConcentration that slows down the anaerobic treatment resulting in low efficiency.cConcentration that can be accepted with some microbial acclimation.Ammonia and ammonium ion are also toxic compounds found in anaerobic reactorsproduced normally during the anaerobic degradation <strong>of</strong> proteins or urea, which are present insome industrial wastes and in concentrated municipal sludge (McCarty, 1964; Speece, 1996).The ammonia concentration depends on the pH and can be present as mostly as the ammoniumion (NH 4 + ) at pH values below 7.25, or mostly as dissolved ammonia gas (NH 3 ) at higher pHvalues (McCarty, 1964). Concentrations reported as inhibitory vary <strong>from</strong> 1500 to 3000 mg/L(NH 3 + NH 4 + ) and completely toxic at concentrations above 3,000 mg/L (Rittman and McCarty,1964).High sulfate concentrations can be problematic during anaerobic digestion processesbecause sulfate reducing bacteria (SRB) compete with methanogens for substrate (i.e., acetate)within the reactor. The activity <strong>of</strong> SRB can inhibit methanogens and increase the concentration<strong>of</strong> hydrogen sulfide (H 2 S), which is toxic to the majority <strong>of</strong> the biomass. Hydrogen sulfide is acorrosive gas and its removal <strong>from</strong> the biogas is expensive (Winfrey and Zeikus, 1977;Schönheit et al., 1982; Isa et al., 1986; Parkin, 1990; Speece, 1996). Ranges <strong>of</strong> sulfate inhibitoryconcentrations reported in the literature are presented in Table 2-8.Table 2-8. Inhibitory Sulfate Concentrations for Anaerobic Processes Reported in the Literature.Sulfate concentration, mg/LReference>100 a Winfrey and Zeikus, 1977>200 b Patel et al., 1978>50 c Parkin and Speece, 1982>800 d Parkin and Speece, 1982>145 e Parkin et al., 1990aAnalysis performed in freshwater sediments.bPure cultures <strong>of</strong> methanogens were growth in synthetic media.cValue found in an unacclimated batch digester.dValue found in a submerged anaerobic filter.eValue found in an anaerobic chemostats for acetate systems.In some cases, sulfate can also be favorable for anaerobic treatment. When sulfate isreduced to sulfide by microbial action, it can combine with and precipitate metals such as2-16
- Page 1 and 2: D e c e n t r a l i z e dEvaluation
- Page 3 and 4: The Water Environment Research Foun
- Page 5 and 6: ABSTRACT AND BENEFITSAbstract:This
- Page 7 and 8: 3.1.2 Flux Chamber Inserts for Sept
- Page 9 and 10: LIST OF TABLESES-1 Summary of Metha
- Page 11 and 12: 3-7 Use of Flux Chamber in the Soil
- Page 13 and 14: Evaluation of Greenhouse Gas Emissi
- Page 15 and 16: tank is converted anaerobically. Fu
- Page 17 and 18: RecommendationsBased on the finding
- Page 19 and 20: ♦♦Collection of gas samples fro
- Page 21 and 22: include Imhoff tanks, anaerobic baf
- Page 23 and 24: 2.2 Septic Tank CharacteristicsSept
- Page 25 and 26: 2.2.3 General Conversion Processes
- Page 27 and 28: increase in thickness with daily so
- Page 29 and 30: environmental damage and/or health
- Page 31 and 32: Figure 2-6. The Intermediate Steps
- Page 33: In anaerobic reactors, the alkalini
- Page 37 and 38: 2.4 Gas Emissions from Septic Syste
- Page 39 and 40: Figure 2-9. Flux Chamber Designed b
- Page 41 and 42: due to settling and anaerobic diges
- Page 43 and 44: total methane production value of 1
- Page 45 and 46: 2-26
- Page 47 and 48: The main body of the flux chamber w
- Page 49 and 50: 3.1.3 Flux Chamber Design for Use i
- Page 51 and 52: 3.2 Sampling ProtocolsThe three pri
- Page 53 and 54: 3.2.3 Sampling Method for Vent Syst
- Page 55 and 56: 3.3 Gas AnalysisThe gas samples wer
- Page 57 and 58: ppm (raw data from laboratory) were
- Page 59 and 60: gal. Sites 5, 6, and 7 were the onl
- Page 61 and 62: Table 4-2. Continued from previous
- Page 63 and 64: Three of the septic tanks that appe
- Page 65 and 66: steeper than that for the rest of t
- Page 67 and 68: espectively, and for methane were 4
- Page 69 and 70: oth before and after the septic tan
- Page 71 and 72: noted that in this approach it is a
- Page 73 and 74: The septic tank effluent CO 2 equiv
- Page 75 and 76: (a)(b)Figure 5-9. Gas Emission Rate
- Page 77 and 78: Figure 5-11. Emission Rates from Si
- Page 79 and 80: (a)(b)Figure 5-13. Views of the Eff
- Page 81 and 82: It is important to note that the U.
- Page 83 and 84: ♦ Methane generated during the an
- Page 85 and 86:
A-2
- Page 87 and 88:
B. Based on COD Loading1. Determine
- Page 89 and 90:
C-2
- Page 91 and 92:
2. First row of Table 23 from Sasse
- Page 93 and 94:
Biogas production = (COD inflow - C
- Page 95 and 96:
E-2
- Page 97 and 98:
SAMPLING FROM SOIL SURFACEDate:Hour
- Page 99 and 100:
F-4
- Page 101 and 102:
G-2
- Page 103 and 104:
DateSamplelocationGas measurement (
- Page 105 and 106:
After the initial inspections, Site
- Page 107 and 108:
H-2 Site 2The scum layer in the fir
- Page 109 and 110:
Table H-10. GHG Emission Rates From
- Page 111 and 112:
Table H-14. Summary of the Water Qu
- Page 113 and 114:
Table H-18. Summary of the Water Qu
- Page 115 and 116:
Table H-22. GHG Emission Rates from
- Page 117 and 118:
Sample Gas measurement (g/capita·d
- Page 119 and 120:
H-9 Summary of ResultsA summary of
- Page 121 and 122:
I-2
- Page 123 and 124:
Treatment in Decentralized Wastewat
- Page 125 and 126:
Philip, H., S. Maunoir, A. Rambaud,
- Page 127 and 128:
Winfrey, M.R. and J.G. Zeikus (1977
- Page 129 and 130:
Fort Worth, City ofHouston, City of
- Page 132:
W E R F P r o d u c t O r d e r F o